Build a Datadog alternative in 5 minutes
I built an open source template that you can use to have a free, simple Datadog alternative in about 5 minutes. Here was my process for building it.

Today we're publicly announcing our open source Logs Explorer template, a free Next.js app + Tinybird backend that you can deploy for free in less than 5 minutes to use as a simple Datadog alternative or to build user-facing logs analytics features (like Vercel Observability or Supabase Query Logs) in your app or service.
You can deploy the template here, check out a live demo with 1.5 billion logs, or fork the repo and modify it locally to fit your use case.
If you want to learn how I built it, keep reading. We recently wrote about how to scale log analytics to trillions of rows and thousands of queries per second. This is a hard problem to solve, so when I build such systems, I like to start with the most basic version. It allows me to iterate faster, test the system end-to-end under real conditions, and then optimize for scale when and where it's needed.
If you want to build a performant logs explorer for yourself or your users, this template is the way to get started and skip all the work I did to get here. Still, if you're interested in my process so you can build a log explorer that scales to trillions of rows and thousands of queries per second, from local to cloud., it's below.
Who doesn't love a hype video?
The basic process
Here's my basic process distilled into bullet points. I'll expand more below.
The stack
- Tinybird and Vercel
- Next.js
- Cursor.ai and Claude Sonnet 3.5
The development workflow
- Develop, build and test locally
- Bootstrap with
tb create - Use LLMs when it make sense
- Use version control and CI/CD
Instrumentation
- Use Tinybird’s Events API to stream logs directly via HTTP, and/or
- Use vector.dev as a log collector
The data
- Use one table to store logs
- Sort it by the columns users need to filter
- Support semi-structured metadata with JSON or String columns
The APIs
- Start with basic APIs to validate end to end
- Allow filtering by dimensions and date ranges
- Aggregate metrics
- Implement basic text search and pagination - Test your APIs with fixtures to maximize coverage
The local dev environment
This is my local setup from scratch.
I use Tinybird local for the data layer:
Next.js for the webapp layer:
The rest of my tech stack consists of:
- Cursor to assist me with the code, Claude Sonnet 3.5 as the LLM model
- git for version control
- GitHub Actions for CI/CD
- Tinybird and Vercel for cloud deployments
tb dev and npm run dev are equivalent. tb dev builds the Tinybird project and the npm run dev builds the Next.js project, both locally. The builds hot refresh on detected changes to their respective files, allowing for faster feedback loops.
The bootstrap
I bootstrapped the whole project with a single command and this is what it generated:
Alternatively, I could have created each resource one by one:
This, for example, is the logs data source generated:
I then instructed the LLM to fine tune the schemas. Some examples:
- “choose the right precision for timestamps and numbers and LowCardinality for repeated values”
- “add the most common dimensions to the sorting key to make the queries more efficient: timestamp, environment, service and level”
- “partition by month” (year or day could work as well depending on my volume)
- “add a TTL for data retention”
(you could also do this on your own in the generated files, but I was vibe coding)
Here's my expert advice:
- Tinybird makes it easy to evolve schemas in a declarative way. So, don't worry if you get anything wrong, you can just change it later.
- Don't over-engineer unless you have a good reason. For instance, I keep all my logs in one table
- If you need to report on unstructured data, add a JSON or JSON String column to store it.
Once the project was bootstrapped, I built it, grabbed a token, and added the token to my .env.local to integrate it with my local Next.js app build.
The mock data and fixtures
I used mock data to test my build.
Generating mock data takes a little bit of time, but it's part of the development workflow.
I wanted mock data to:
- Write tests that I could run locally to validate quickly as I changed resources
- Create data fixtures to run tests as part of CI to catch regressions early on
- Have a local data source to test the end-to-end Next.js app integration
I don't have a preferred approach here. tb create already generated a logs.ndjson fixture that I could fine tune and use.
Other options include:
- Use
tb mock --rows 1000 logsto generate a bigger sample (you can supply a prompt to give it some direction. I've done this with up to a million rows locally with no problem. It's just an NDJSON file so it's not that big.) - Use mockingbird for streaming ingestion to a cloud deployment (there's an example schema in the template repo)
- Create a custom data generator. LLMs are perfect for building "throwaway code" like this. You can simulate traffic patterns, seasonality, and other stuff without having to code it yourself.
- Export random data from production. Keep in mind, this can be a bad idea if it means downloading PII to your machine.
The APIs
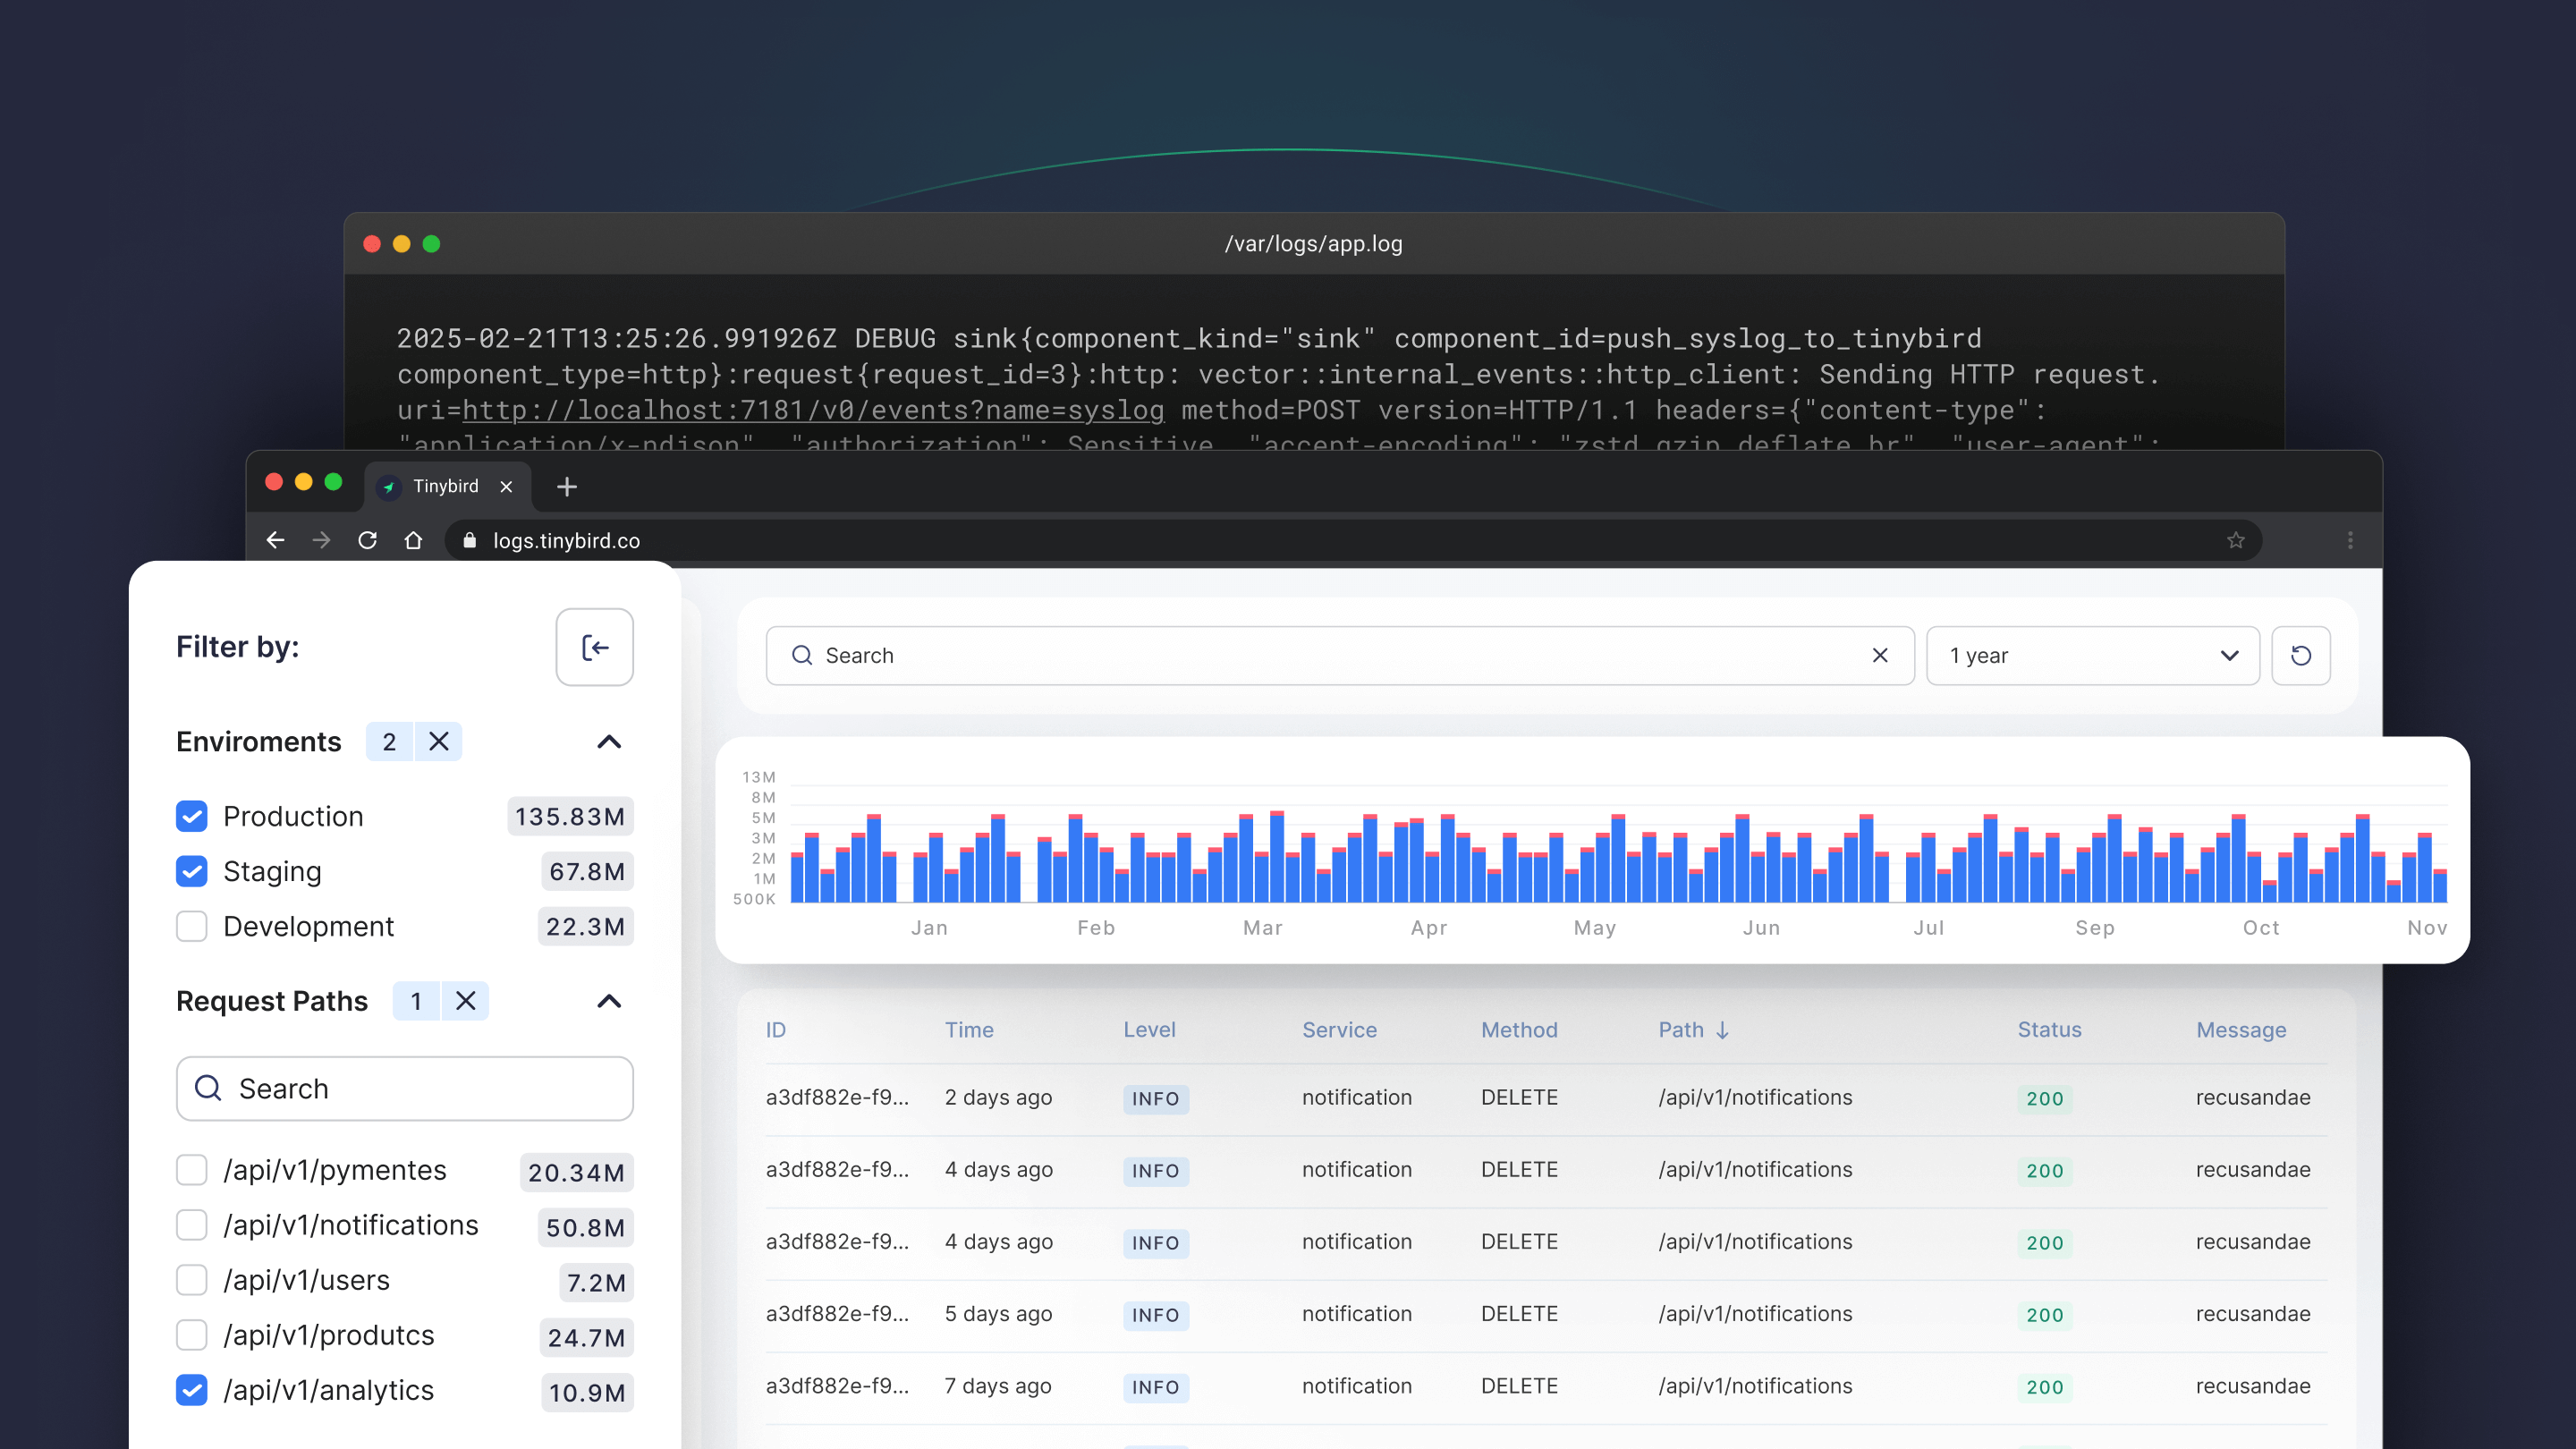
The logs explorer UI consists of these components:
- The sidebar (with counts) for easy filtering and aggregation
- The search bar to filter by an arbitrary text match
- The time series chart to show the evolution of the logs over time
- The date range selector to filter by time range
- The table view to show all the logs in a table
- The details drawer to show the details of a specific log
A quick glance at the features in the logs explorer UI
I fed all five visual components with just three APIs. Again, I didn't over-engineer at the beginning. I just needed APIs to support the components, and I could to optimize them later.
Here's a look at each API that I built:
Sidebar counts
One nice thing about the template is it dynamically populates the sidebar with dimensions sorted by logs counts for each one.
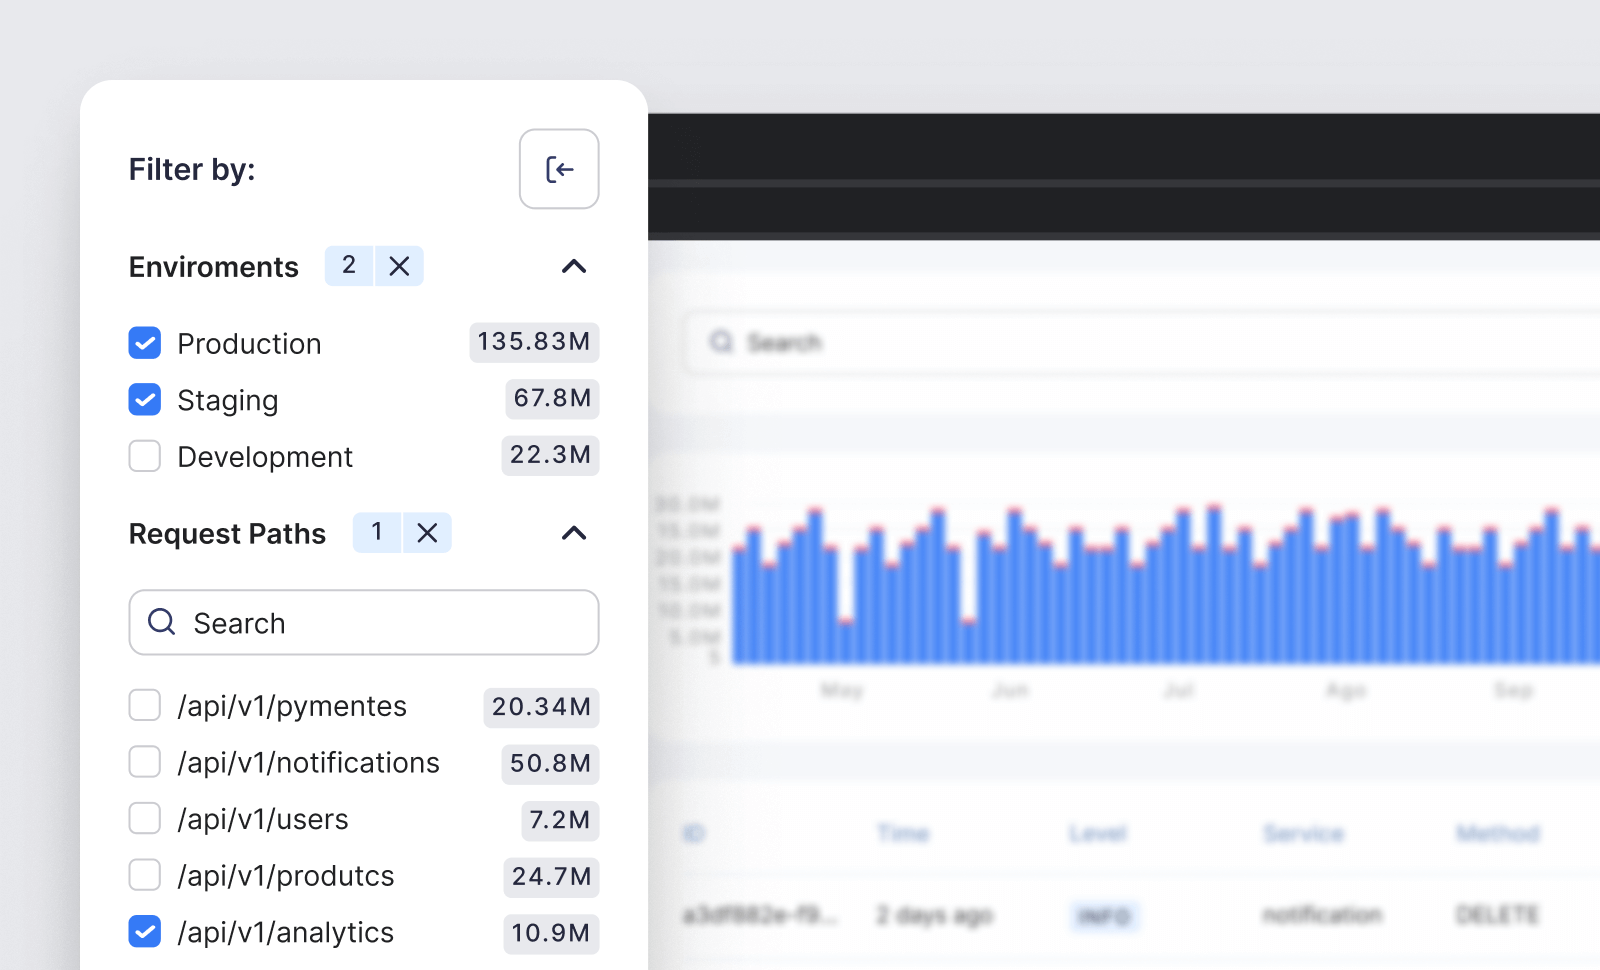
I created a Tinybird API to add counts for each of the filterable columns in the logs schema, going top-down from more general to more specific filters: environment > service > level > others.
A single pipe can support multiple counters using Tinybird's templating, for example:
This pipe uses Tinybird's template functions to dynamically request the specific column I want to filter on.
As a reminder, every Tinybird pipe is automatically a REST endpoint. I can query it directly like this:
This is just the basics; I'm not supporting all possible filters just yet.
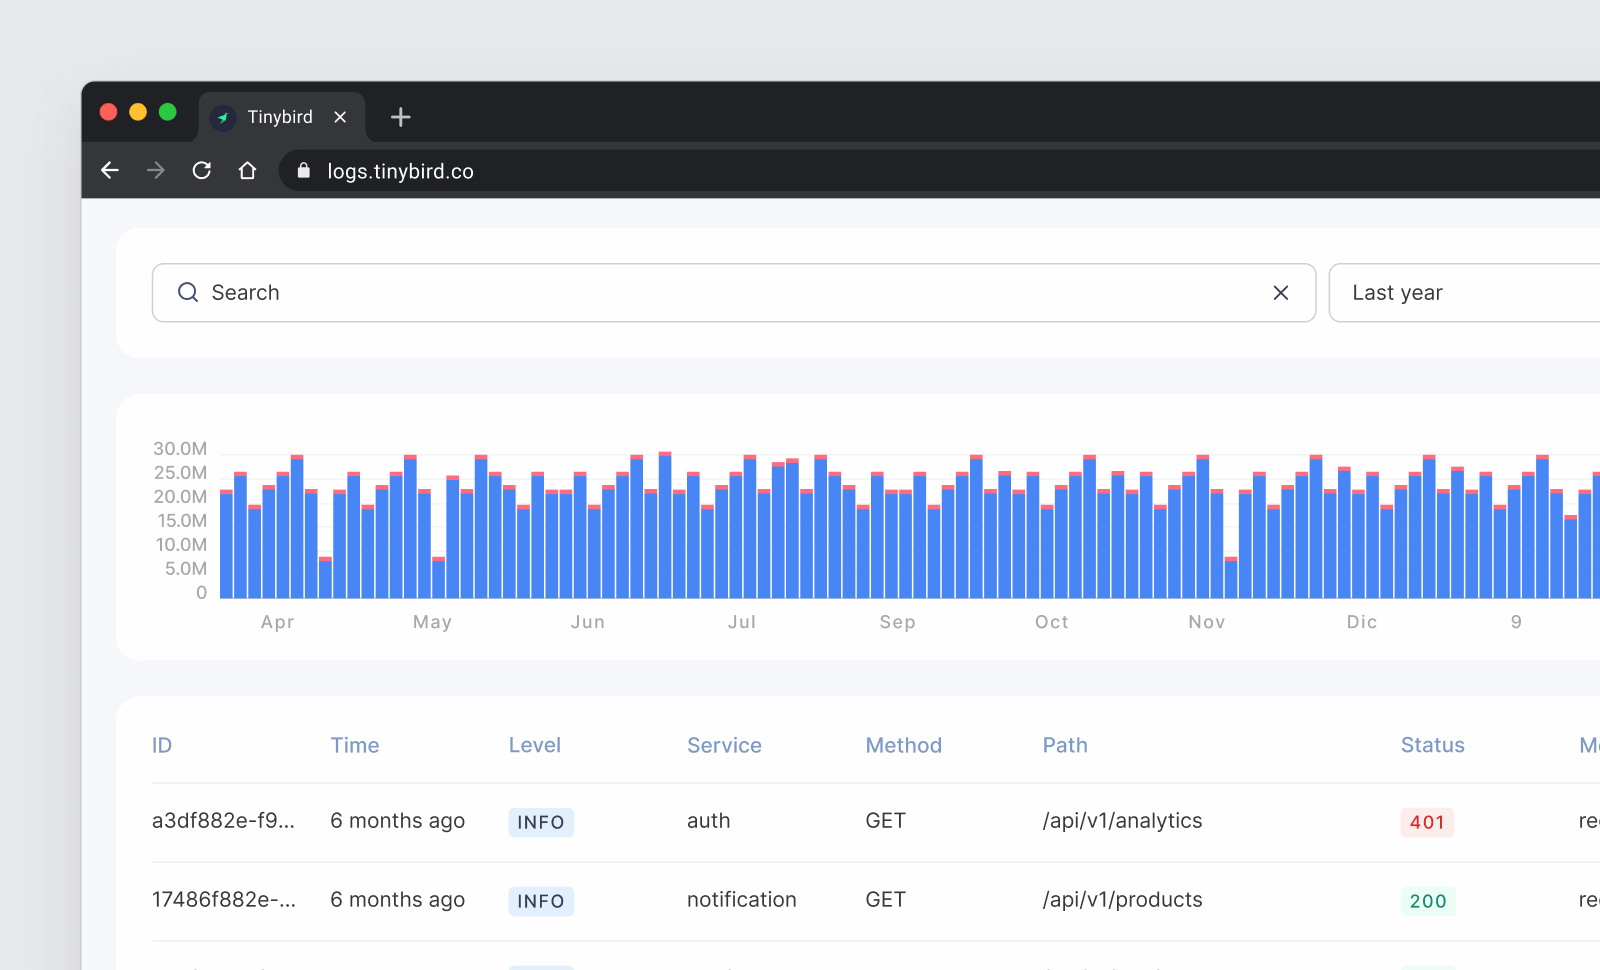
Logs search and exploration
The search bar, table, and details view are all based on the same API that just allows filtering the raw logs on all the various supplied dimensions:
I use Array parameters to support multiple values for each filter.
Whenever I make a selection on the sidebar components, the date range selector, or the search bar, the API will be called with the corresponding parameters (using some React hook), to list the corresponding rows.
Note that this API is not optimized at all. For instance, LIMIT, OFFSET, and filtering with a like expression will generally not be performant at scale, but that's just fine for now. This is just a simple way to query the logs to build the end-to-end logs explorer. I can (and did) optimize it later.
An example of a query with all the filters:
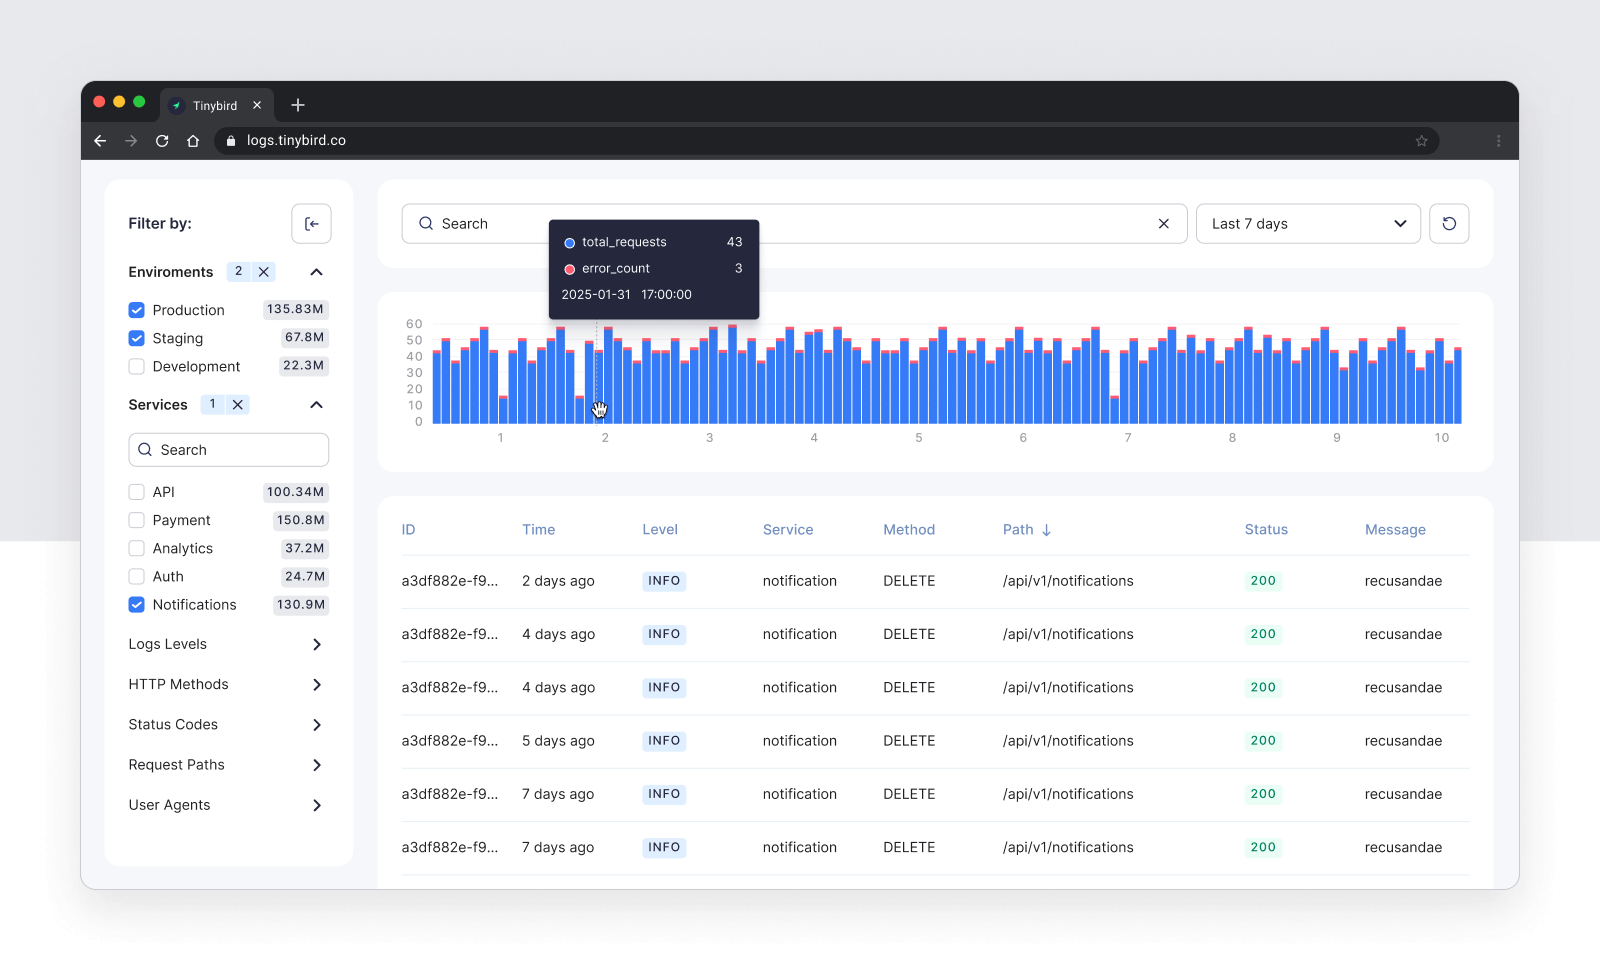
Time series chart
The time series chart is based on a pipe that aggregates the data by time period. I can have multiple metrics and dimensions depending on my needs.
The most basic is a counter of events and errors over time, grouped by hour:
This is aggregating the raw logs. I know 100% this is not going to scale, but for now it's just fine. Remember, I'm building a working end-to-end logs explorer, not optimizing for scale… yet.
As with my other APIs, I can query it like this:
That's all the APIs I needed for my logs explorer.
On to the Next.js application…
Next.js integration
I used zod-bird to integrate Tinybird APIs (pipes and events) with Next.js. It's a wrapper around the Tinybird APIs that validates pipe results using zod schemas.
This is the generated zod-bird client.
I defined Tinybird tokens using environment variables:
This way, I could change them in Vercel without changing the code. (btw, you can learn more about Tinybird authorization mechanisms for Next.js apps in the Next.js integration guide.
For charts I used @tinybirdco/charts.
Testing the data layer
I wanted full testing coverage of my APIs so that when I eventually optimized them I could be confident that the interface between my data and app layer wouldn't break.
Tinybird simplifies this a lot, I just asked the integrated LLM to create a test and then update the assertions: tb test create && tb test update. This generates a test .yaml that can be run locally or during CI.
I supplied a prompt to create more specific tests, for example:
For full coverage, I instructed the LLM to create specific tests or fine tune the tests params to match my mock data, and I ran tb test update to update the assertions.
See how Tinybird tests are defined here.
CI/CD
I used the GitHub Actions generated by tb create.
The process is simple:
- CI: build the project and run tests
- CD: deploy to Tinybird Cloud and Vercel
I usually want to deploy the Tinybird project first and then the Next.js application, since they have different life cycles, ensuring they are both backwards compatible.
Instrumentation
You can obviously use mock data to test, but eventually you want real logs from your app. Whether you generate your own logs or use third party libraries or services, you need a way to get your logs into the Tinybird logs data source.
Here are some strategies to instrument your application logs.
The most basic approach is to make your application send logs directly to the Events API, a piece of data infrastructure that can ingest data at scale. Optionally, you can add some buffering and retries or a fire and forget strategy for logs that are not critical.
If you prefer a Sidecar or Gateway strategy, you can use Vector.dev as a log collector. Vector.dev integrates with all the popular services and the Tinybird Events API.
Here is an example of using Vector.dev to send logs to Tinybird.
Conclusion
I built a Datadog alternative for logs in less than a day using modern dev tools that play well with LLMs.
The initial end-to-end product wasn't perfect or optimized for scale, but it proved my project and gave me a good foundation to iterate and deploy changes as I improved them.
The Logs Explorer template builds on what I shared here, but it is optimized to handle billions of logs and thousands of concurrent user requests. Fork the template and modify it for your use case. (Demo here).
You can dig into the code if you want to see the specific optimizations I applied (hint, they're based on this). Or, check in tomorrow for Part II of this post, where I'll share my specific optimization techniques to scale the template to support billions or even trillions of logs.