You built a Datadog alternative. Now scale it.
I bootstrapped a logs explorer, but I knew it wouldn't scale. Here's how I optimized the data pipeline for billions of logs and thousands of users.

Earlier today, we launched the Logs Explorer template. I wrote a blog post that showed how to build the basic version of the logs explorer, focusing on the end-to-end experience, web components, and the data layer. I was able to build an end-to-end product locally and deploy it to the cloud really fast. And while it worked, it wasn't optimized.
So, allow me to share how I optimized our Logs Explorer template to be able to handle trillions of logs and still have sub-second refresh times in a Next app that may be accessed by thousands of concurrent users.
When should I optimize for scale?
The usual sign is performance issues, specifically, queries taking too long to complete. There could also be cost concerns - you could build something like this on an inefficient stack, and while performance might be okay it might cost a lot to maintain it.
That said, I usually don't wait for the app to have performance issues, I preemptively look for the bottlenecks and start optimizing for performance and cost.
Where should I start?
We packed several years of knowledge into a blog post about building scalable log analytics.
Let’s put that knowledge to work and optimize the logs explorer for scale.
A simple approach is to generate a bunch of data that mocks my production load and see how the app performs. For this specific case, I used a custom script to generate mock logs data so I can fully customize it.
The basic version of the logs explorer already defined the data layer interfaces by means of Tinybird pipes deployed as APIs. I'm focused on optimizing the underlying data layer while keeping those interfaces intact.
This way, the Next.js app is not affected, and I can just iterate the data layer without changing the web components. Tests will report any regression on the APIs, and if needed I can just tb test update them.
How do I filter logs at scale?
The short answer is materialized views, and the long answer can be found in these strategies. Continue reading for practical examples.
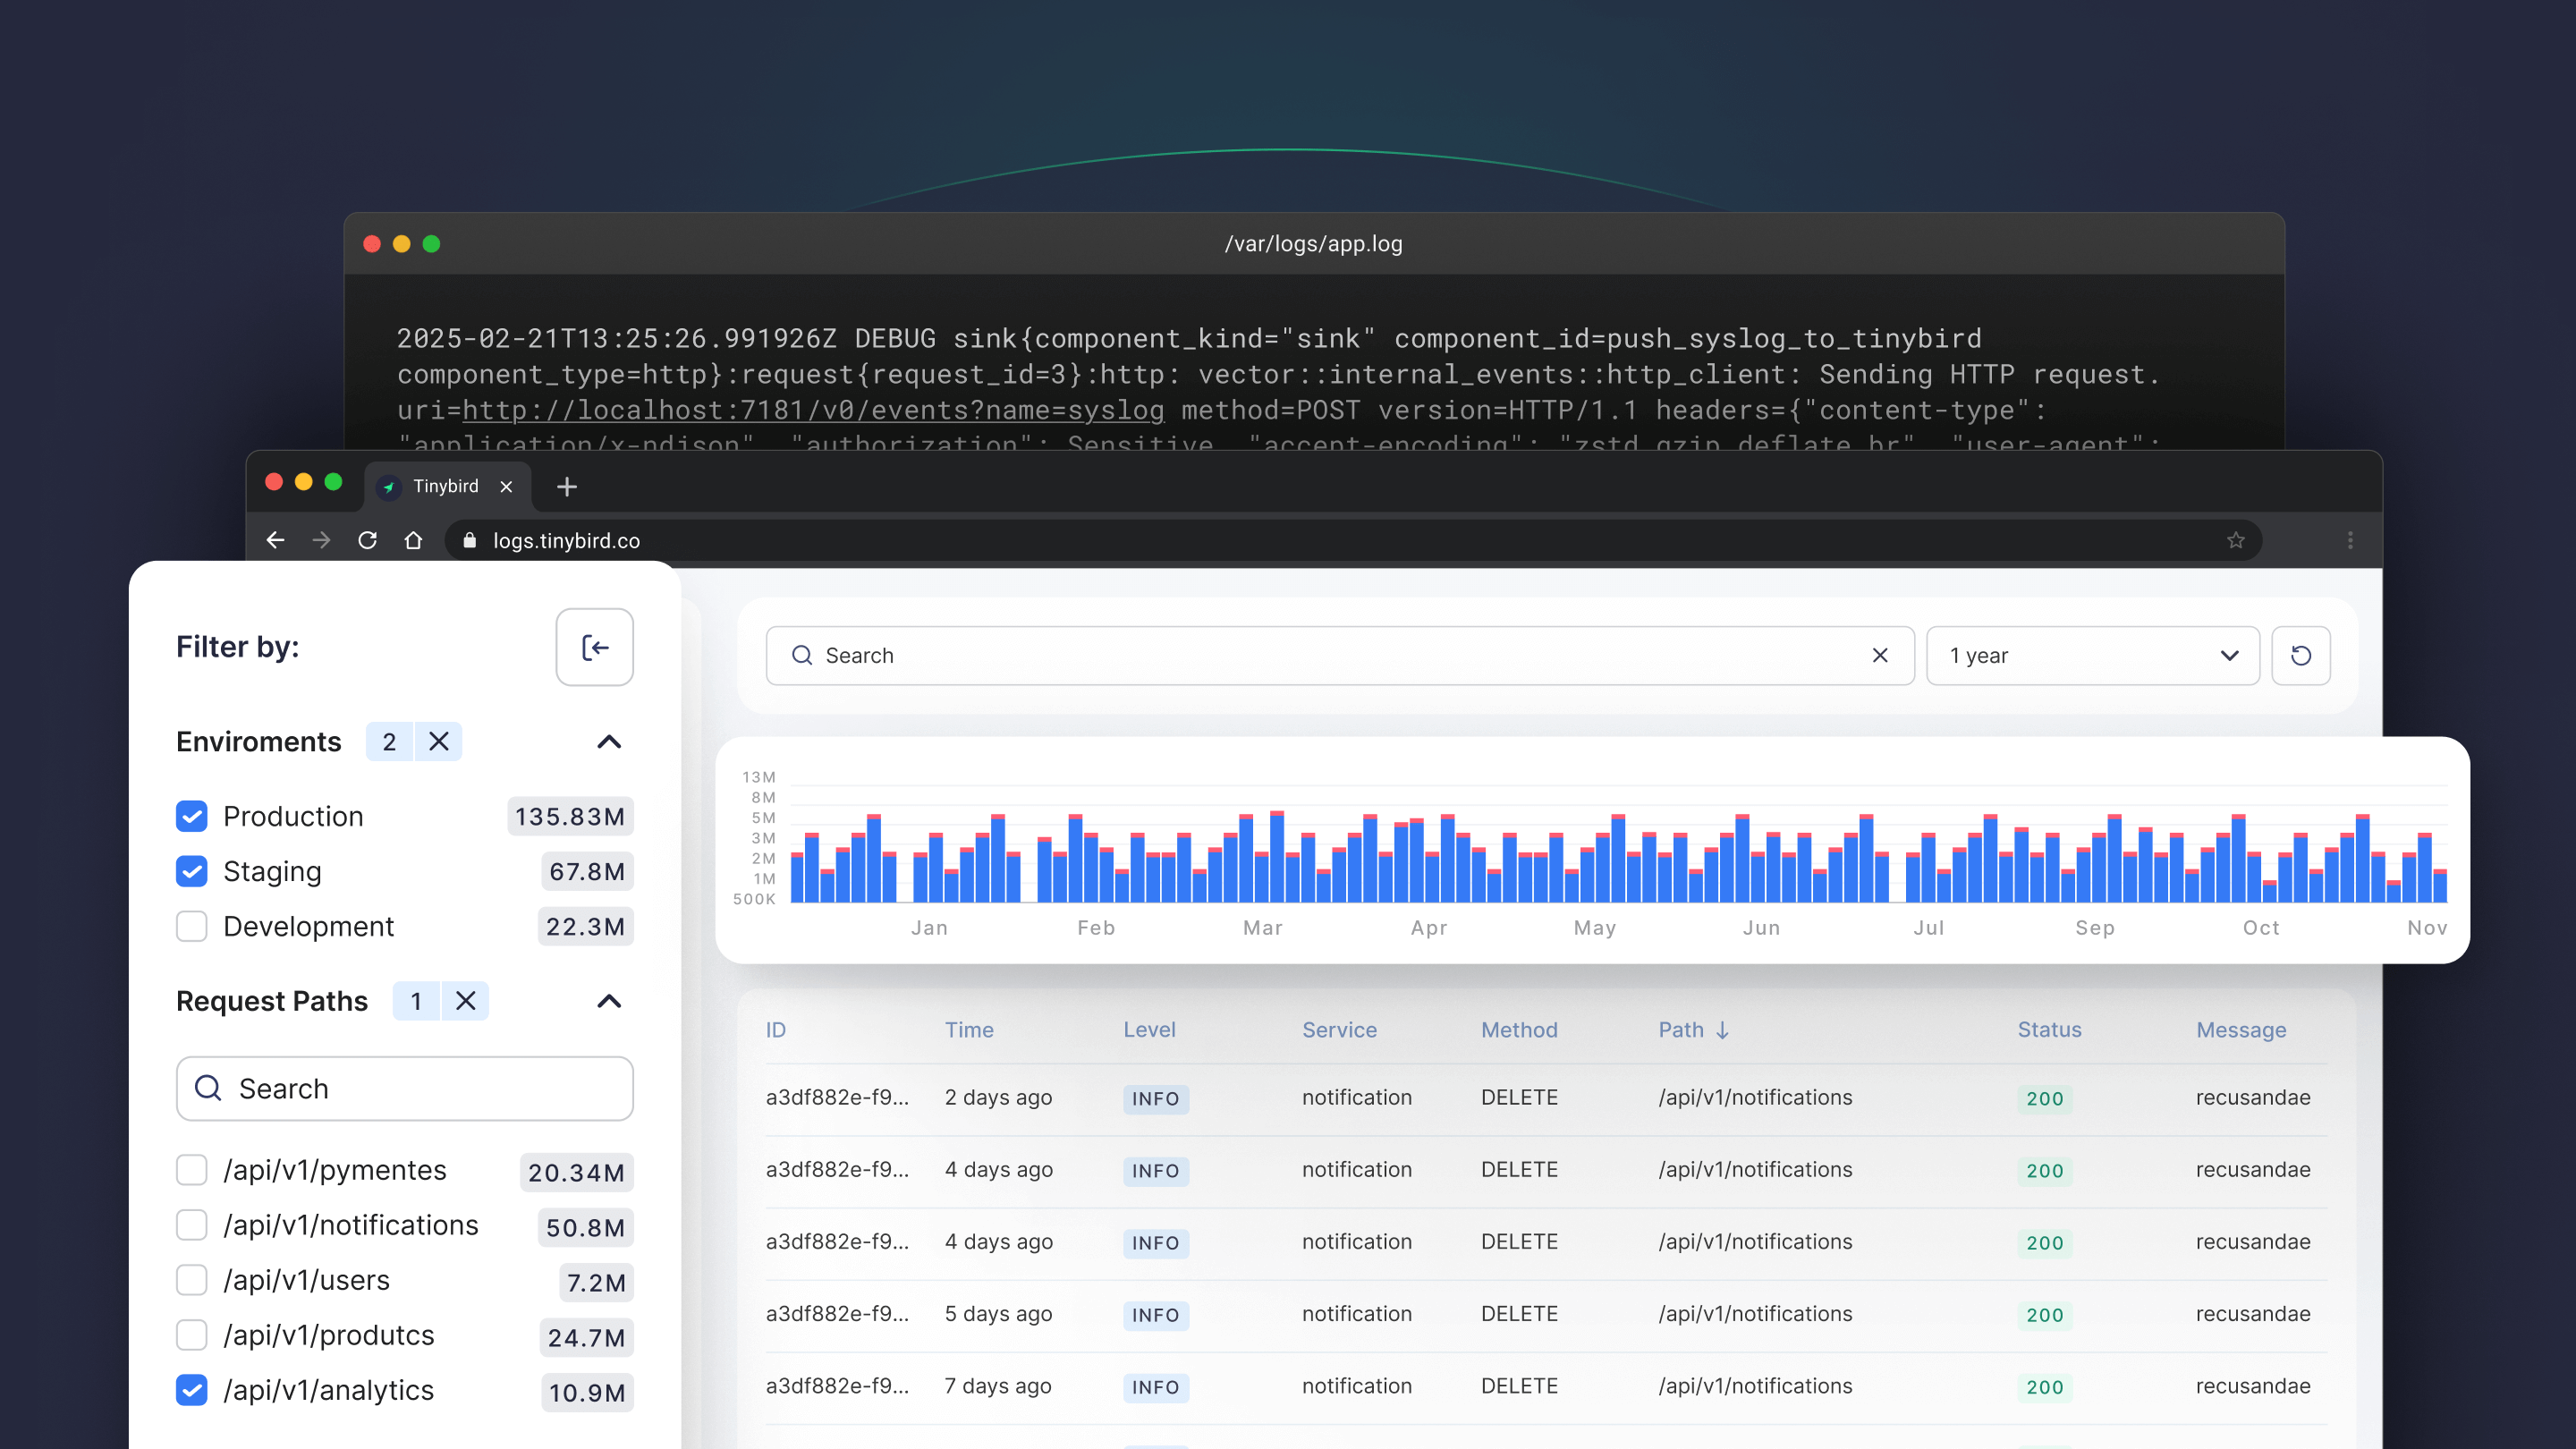
Optimizing the sidebar counters
The sidebar includes filtered counts of the logs by various dimensions. I can pre-aggregate them using materialized views.
In Tinybird, the materialization happens in real-time, triggered by writes to the database, not manual refreshes. So these counters are always up to date.
Then I can update the pipe that defines my sidebar API to use the materialized view instead of the raw logs table:
I use a conditional template to use the pre-aggregated materialized view when 10 or more hours of data are selected, and the raw logs data source otherwise. This is fine for the 1.5b rows use case, but it allows for further optimizations.
For instance, I could pre-aggregate by month or even year and change the pipe logic to make use of larger rollups when the date range is large. I could also combine multiple materialized views, for instance, the monthly one for full months and then the daily one for the remaining days and the raw logs for the remaining hours or minutes.
You can check this blog post for more details about creating rollups with materialized views
What you need to learn from this is:
- Always optimize for your scale. Sometimes raw logs queries are just fine, but sometimes you need to pre-aggregate.
- Materialized views are your friend at scale.
- Use conditional templates to decide when to use the pre-aggregated data or the raw logs.
- Use materialized view rollups to optimize for large date ranges.
- Modify the underlying data pipeline without changing the interfaces (APIs), and use tests to check for regressions.
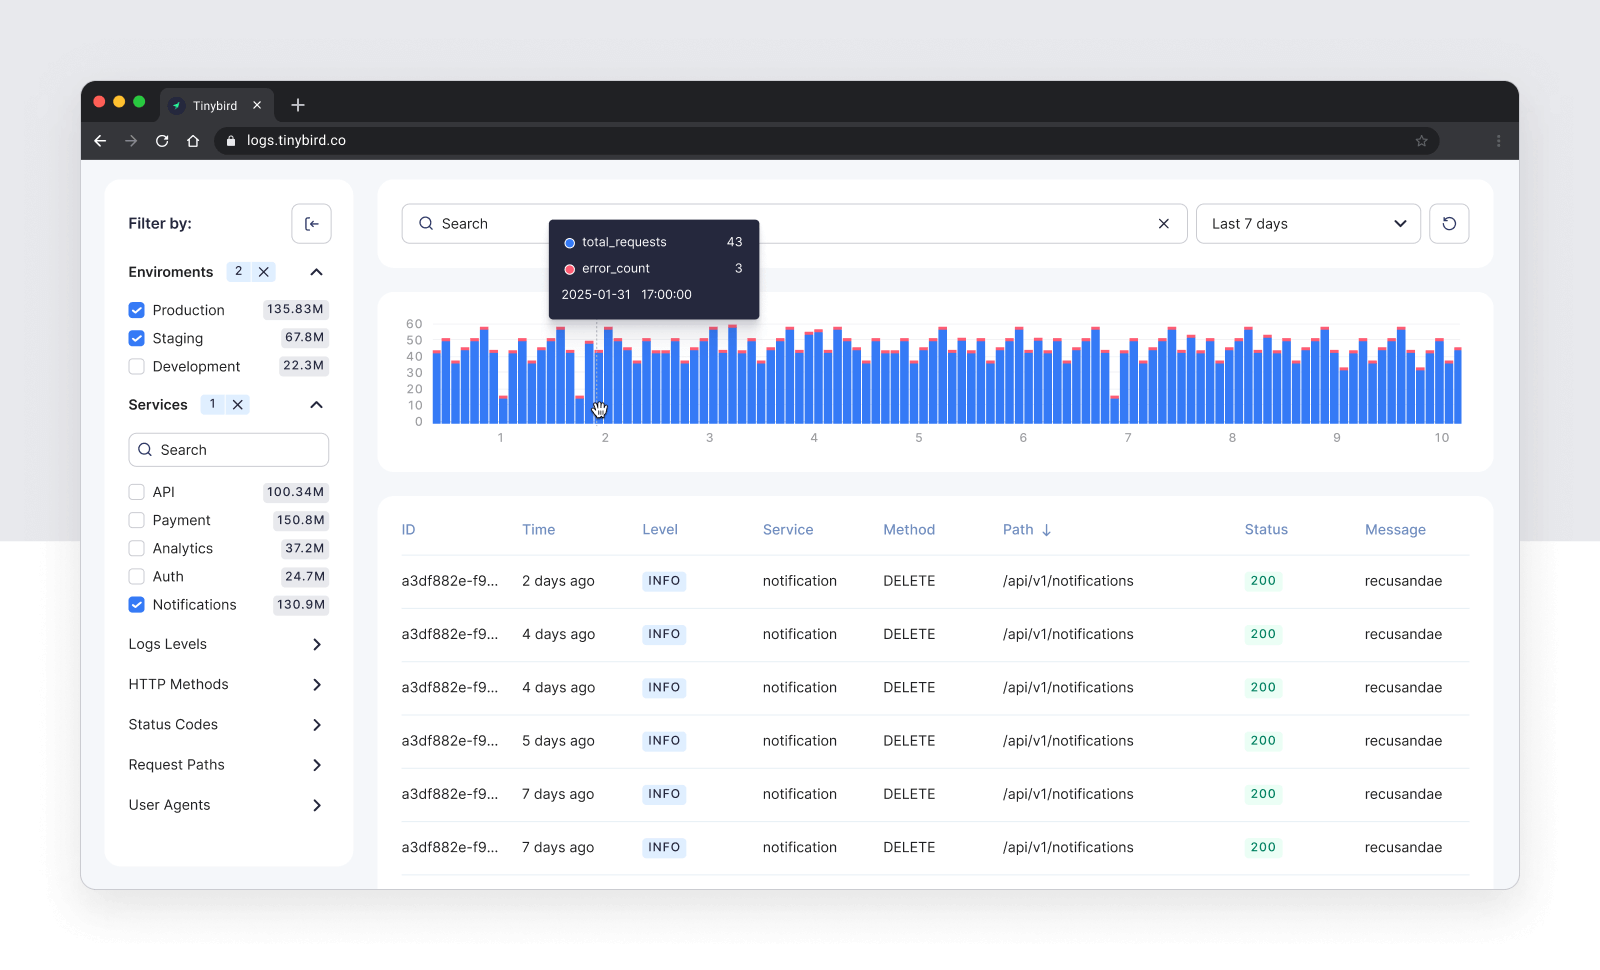
Optimizing the time series chart
The time series chart follows a similar pattern to the sidebar counters. I can pre-aggregate the data by time range using a materialized view.
Once you learn about materialized views, it's the default approach to optimize for scale.
The pipe logic is a little more involved than in the sidebar, but the idea is the same: Use a conditional template to decide when to use the pre-aggregated data or the raw logs. In this case, I change the time range grouping depending on the selected data range filter.
Again, the conditions are based on my use case, and there’s still room to scale using rollups, different granularities, etc.
One important thing to mention when working with time series is making sure you always fill the gaps.
In this case, I have specific nodes that calculate the time series for each time bucket.
I then merge thed generate time intervals with the logs data by joining both nodes:
So the pipe logic is:
- Generate a time series for each time bucket.
- Calculate the actual data for the time range, using conditional templates to decide when to use the pre-aggregated data or the raw logs.
- Fill the gaps by merging the generated time series with the actual data.
Free text search: Optimizing the search bar
Materialized Views are a powerful tool to optimize for scale, allowing for rolling aggregations that then you can leverage in your pipes by means of conditional templates.
Searching is a different topic, and we have several blog posts about how to scale text search (Using Bloom filter text indexes for real-time search and implementing text search at scale with Tinybird).
For this specific case, I'm just using multiSearchAnyCaseInsensitive to search for the logs that match the query without any special indexes.
This allows users to search for logs like this memory|timeout and it will match Memory Limit or Timeout exceeded in the message column.
In my solution, text search works over the raw logs table, which requires the next optimization (or better said, "restriction"): interaction design for scale.
How do I design a UX for scale?
An important takeaway from this process is that you don't just optimize your data layer to fit any scale, you also must optimize your interaction design to fit the scale.
For instance, you don't want to let your users do a free text search query on 1b rows, you don't even want them to do it on 100M rows. A one time query on 1b rows could be fine, but when you are building a public facing application you want to optimize for high-concurrency and throughput.
You don't want your users to do a free text search over aggregated data, so your design needs to be smart about when to query the raw logs and when to use the pre-aggregated data.
Since I designed my data layer to be filtered by timestamp, environment, service, level, I also optimize my interaction design so users filter by them.
I considered these things when designing the UI for the logs explorer, that's why data is pre-filtered to include just the last 3 days, which is fine for my scale. Environment, service, and level are expanded so users can select one or more options. And the search bar is disabled unless a user has filtered to a certain number of rows.
Note I don't restrict the API, but the tool where the users interact with it.
When it comes to time series, choosing the right aggregation level given a date range is another interaction design problem.
The simple takeaway is this: build your data layer for scale, and make interaction design choices that fit the scale.
How do I paginate at scale?
One last problem to solve is pagination. I implemented an infinite scroll that works in two ways:
1. When the logs are filtered by search text, I just use LIMIT, OFFSET and ORDER BY to paginate. This is a tradeoff in which I assume the user is looking for a specific log and the raw data has already been properly filtered.
2. When logs are filtered by other dimensions, and the amount of data maybe be much larger, I use pre-aggregated data to find a date range that fits the current page, and then filter the raw logs by that date range and the rest of dimensions. I use LIMIT and OFFSET to paginate, until moving to the next date range. This is useful when users are just exploring the data and don't have a specific log in mind. You can learn more here about mapping date ranges to limits for performance.
This is how it works in practice.
First, I built a Materialized View that pre-aggregates the logs into 15-minute periods by the three main filtering dimensions: environment, service, and level.
Then I implement the logic in a logs_explorer pipe, which first gets the date range for the current page and then filters the raw logs.
So I now have two APIs for logs exploration.
- log_analysis which allows users to filter by message and other dimensions.
- log_explorer which allows users to efficiently explore the data with optimized pagination.
The Next.js app decides which API to use based on the current selected filters or URL params. See the infinite scroll and log table implementation for more details.
What's my development workflow?
When I started building this, I just wanted an MVP, and I knew I would come back to optimize. The development workflow is iterative, so I put in the foundation for iterative work so I could ship something simple and come back to make it faster.
Iterating is much easier and faster when done locally. I start both Tinybird and the Next.js app locally and integrate them together, adjusting the web components as I work on the APIs.
tb dev && npm run dev provide an instant feedback loop for Tinybird and the Next app, so I can build both apps locally, run tests, and validate the live integration in my browser.
The workflow plays well with the tools and processes I’m already used to: Cursor, a terminal, git, CI/CD, etc.
Deployments are declarative, and I can test them locally before running to production, removing all friction from complex data migrations. For instance, this is all I had to do to change the logs table sorting key.
Conclusion
In these two blog posts I've shown how to build a logs explorer that scales to trillions of rows and thousands of queries per second.
I've created a template that you can use to build your own custom logs explorer. It's a great starting point for an internal tool or a public facing application.
You can deploy the Logs Explorer template, or just fork the repo and start building locally.