Data-driven CI pipeline monitoring with pytest
Recently, we cut our CI pipeline execution time in half. To consummate our work, we've officially published the pytest plugin that made it possible, so you can use it, too.

If you have ever released Python code into production, you have likely used pytest as your framework to test your code. We use it at Tinybird to test our code and catch bugs before they get shipped to prod. And as I will share in this post, pytest has played an important role in our CI/CD pipeline monitoring and performance improvements.
Tinybird’s Continuous Integration and Continuous Deployment/Continuous Delivery (CI/CD) pipeline has become a key tool in our DevOps process that enables us to iterate quickly, shorten our development cycle, and provide the reliability our users depend on.
Recently, as our software evolved, our user base grew, and our team expanded (we're still hiring!), our CI pipeline in GitLab slowed down. We currently have over 3,000 tests, and we often ship multiple times per day, so our pipeline must be fast and accurate. We knew that we needed to invest in additional observability tooling to monitor our CI/CD pipeline, track critical metrics, and debug problems.
We have over 3,000 tests and ship multiple times per day. Our CI pipeline must be fast. In this blog post, I'll explain how we monitor it to keep it fast, and give you the tools to do so too.
A few months ago, we shared how we cut our CI execution times by over 60% using a data-driven approach to monitor critical CI/CD metrics and integrate them into both our dashboards and automation.
In this blog post, I’ll show how a new pytest plugin and Tinybird helped us achieve and maintain those gains for better observability and, ultimately, better application performance.
Why you need to monitor your CI/CD pipeline
Whether you’re using Jenkins, CircleCI, or any DevOps server, good CI/CD pipeline observability is just good agile DevOps hygiene, plain and simple. It’s vital for catching problems early and making sure your pipeline doesn’t degrade over time.
Good CI/CD pipeline observability is just good agile DevOps hygiene, plain and simple.
Perhaps most importantly, good CI pipeline monitoring lets you ship code faster. Understanding your test results more quickly leads to faster feedback loops, easier team collaboration, and smoother product iterations. Proper observability on our CI pipelines is what allows Tinybird to stay agile and confidently ship up to 100 times a week.
Monitoring also helps you assess the performance and reliability of your CI pipeline. By observing your test cycle times, test failure and system error rates, and test execution times, you can troubleshoot bottlenecks, identify vulnerabilities, and make improvements with load balancing and resource allocation.
Beyond reducing execution times, monitoring is key for finding flaky tests and understanding what causes them. Are tests failing due to code changes, or instead because of race conditions and lack of computing resources? If you can correlate test failure data with system monitoring tools, you can answer fundamental infrastructure questions and reduce flaky tests.
If you’re convinced that performance monitoring for your CI/CD pipeline is important, you’re next question is likely what performance metrics are most important.
9 important metrics for CI/CD pipeline monitoring
Broadly speaking, timing and failure metadata are fundamental and will drive the majority of insights into your pipeline performance. You want to monitor these metrics at the pipeline, job, and test levels. You’ll also want to monitor your CI infrastructure to make sure it’s properly scaled and balanced to support your pipeline.
Pipeline, job, and test timing and failure metadata are fundamental to healthy CI pipeline monitoring, as are CI infrastructure utilization metrics.
Here are 9 critical timing and failure metrics that are worth integrating into your DevOps dashboards:
- Pipeline execution time. This is the obvious one, and you should always track how long it takes your entire CI pipeline to run. This metric is critically important as it impacts your internal development experience and the speed at which you can ship. If your pipeline execution time is 30 minutes, you’ll be less inclined to ship valuable incremental changes.
- Pipeline execution time evolution. Timestamp your pipeline execution times, and monitor how they change over time. Tracking this trend will help you avoid creeping toward untenable pipeline execution times.
- Failure rate per CI run. At Tinybird, we call this “pain level”, because as more tests fail in our pipeline, the more painful it is to resolve them and deploy new code. The higher the pain level, the less confident our developers feel to ship. Keeping pain level (failure rate per run) low is paramount to continuous delivery.
- Time per job. As with overall pipeline execution time, monitor job run times so you can understand which types of jobs are causing bottlenecks. We group our jobs by project (e.g. UI, backend, docs, etc.), test type, and environment (e.g. Python versions).
- Job time evolution. Again, tracking things over time is good, and the run time of individual jobs is no exception. Monitor job time evolution to identify jobs trending towards an issue.
- Failure rate per job. Understanding the failure rate of jobs can help you isolate which projects, packages, or environments are causing you the most problems.
- Test time. It’s good practice to keep track of the run times of individual tests, that way you can isolate the troublemakers. This is a key metric for general test load balancing.
- Test time evolution. Monitor the evolution of time for individual tests as well so you can spot problematic tests trending towards long execution times.
- Failure rate per test. The same idea applies to failure rates. Monitor failure rates per test so you can identify flaky tests more quickly.
In addition to these critical CI pipeline metrics, it’s good practice to monitor your CI infrastructure. At Tinybird, we use Kubernetes to deploy our CI/CD pipelines, and so we monitor the following:
- CPU utilization by namespace
- CPU utilization by node
- Memory utilization by namespace
- Memory utilization by node
- Global network utilization
- Network Saturation
By monitoring CI infrastructure along with CI pipeline metrics, you can correlate pipeline failures to issues with resource utilization or other infrastructure problems. In our case, we were able to identify an issue with our CI orchestrator that was causing inefficient resource use and failing our tests. We ended up deploying each job on its own Kubernetes node, which eliminated resource contention issues and resulted in deterministic pipeline runs.
A pytest plugin and analytics to optimize your CI pipeline
Tinybird is a real-time data platform to capture data from a variety of sources, develop metrics with SQL, and share them as low-latency APIs. It's both the product we're building and the platform we use for CI analytics.
We use Tinybird to capture metrics from CI test runs, analyze and aggregate them with SQL, and publish our metrics as APIs we can use to observe and automate our CI pipeline.
We’ve been dogfooding *ahem* drinking our own Cava to analyze our CI pipeline, connecting Tinybird to Grafana for visualization and even using some of the Tinybird APIs we’ve published to automate test execution order for faster job times.
Recently, we launched the pytest-tinybird plugin to democratize this work, making it much easier to add CI pipeline instrumentation with pytest. You can use this plugin to send pytest CI records to Tinybird, and you can use the SQL snippets I’ve shared in a repo below to calculate critical CI metrics in Tinybird. Then, you can publish them as APIs to visualize and automate your CI pipeline performance.
How the Tinybird pytest plugin works
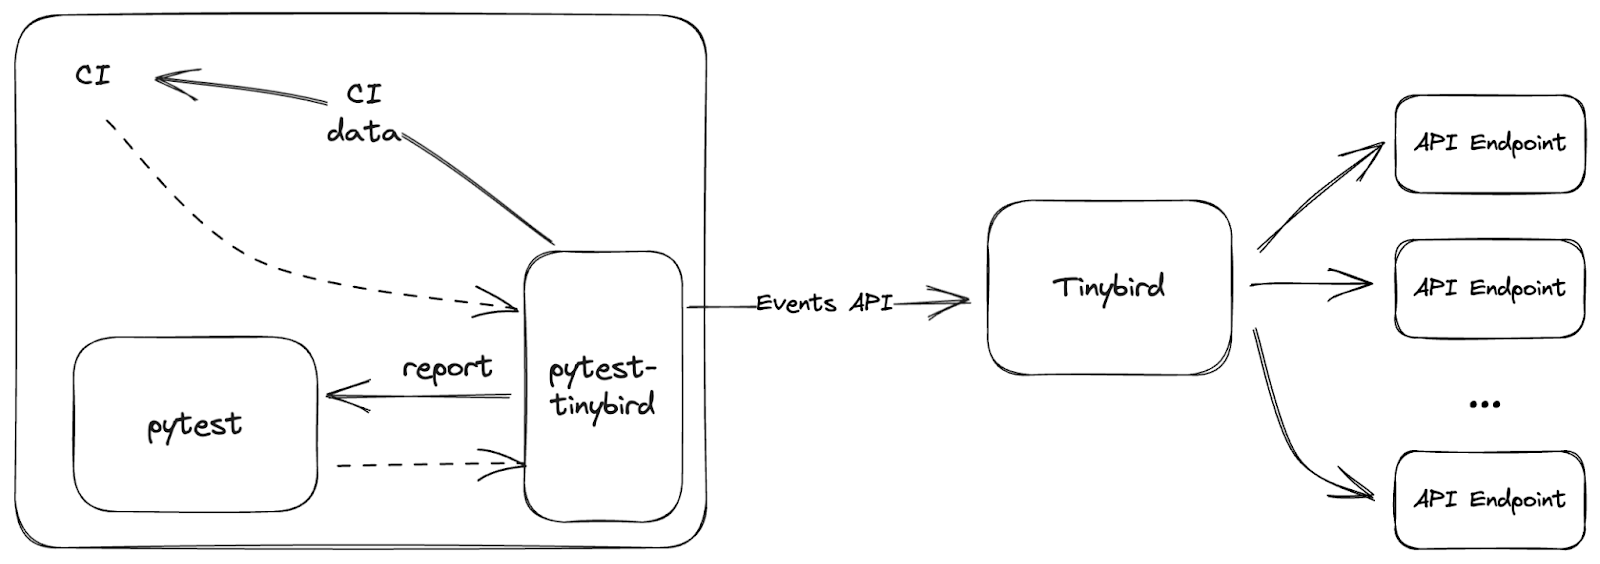
The pytest-tinybird plugin sends test results from your pytest instance to Tinybird every time it runs. By design, this includes the data needed to calculate the critical metrics described above.
At the end of each run, the plugin makes HTTP POST requests using the Tinybird Events API.
The pytest-tinybird captures test metadata from pytest and sends it to Tinybird for analysis.
The plugin automatically captures and sends standard pytest test metadata, including attributes such as test, duration, and outcome.
For each test, a report object with the following attributes is sent to Tinybird:
The plugin automatically creates a Tinybird Data Source with this schema the first time it runs.

Once the data is in Tinybird, you can write SQL to build your metrics and publish them as APIs.
It’s a simple design that belies a simple mission: make it easy to analyze and visualize pytest timing and failure metadata. If you’re interested in browsing the code of the plugin, it’s open source and can be found in this public GitHub repo.
Building CI pipeline metrics in Tinybird
So, the pytest-tinybird plugin sends data to Tinybird, where it is stored in a columnar data store perfect for building aggregate and filtered metrics.
Once your test data lives in Tinybird, you can use SQL to define your CI/CD metrics. Below, for example, is a Tinybird Pipe you could use to calculate job time evolution.
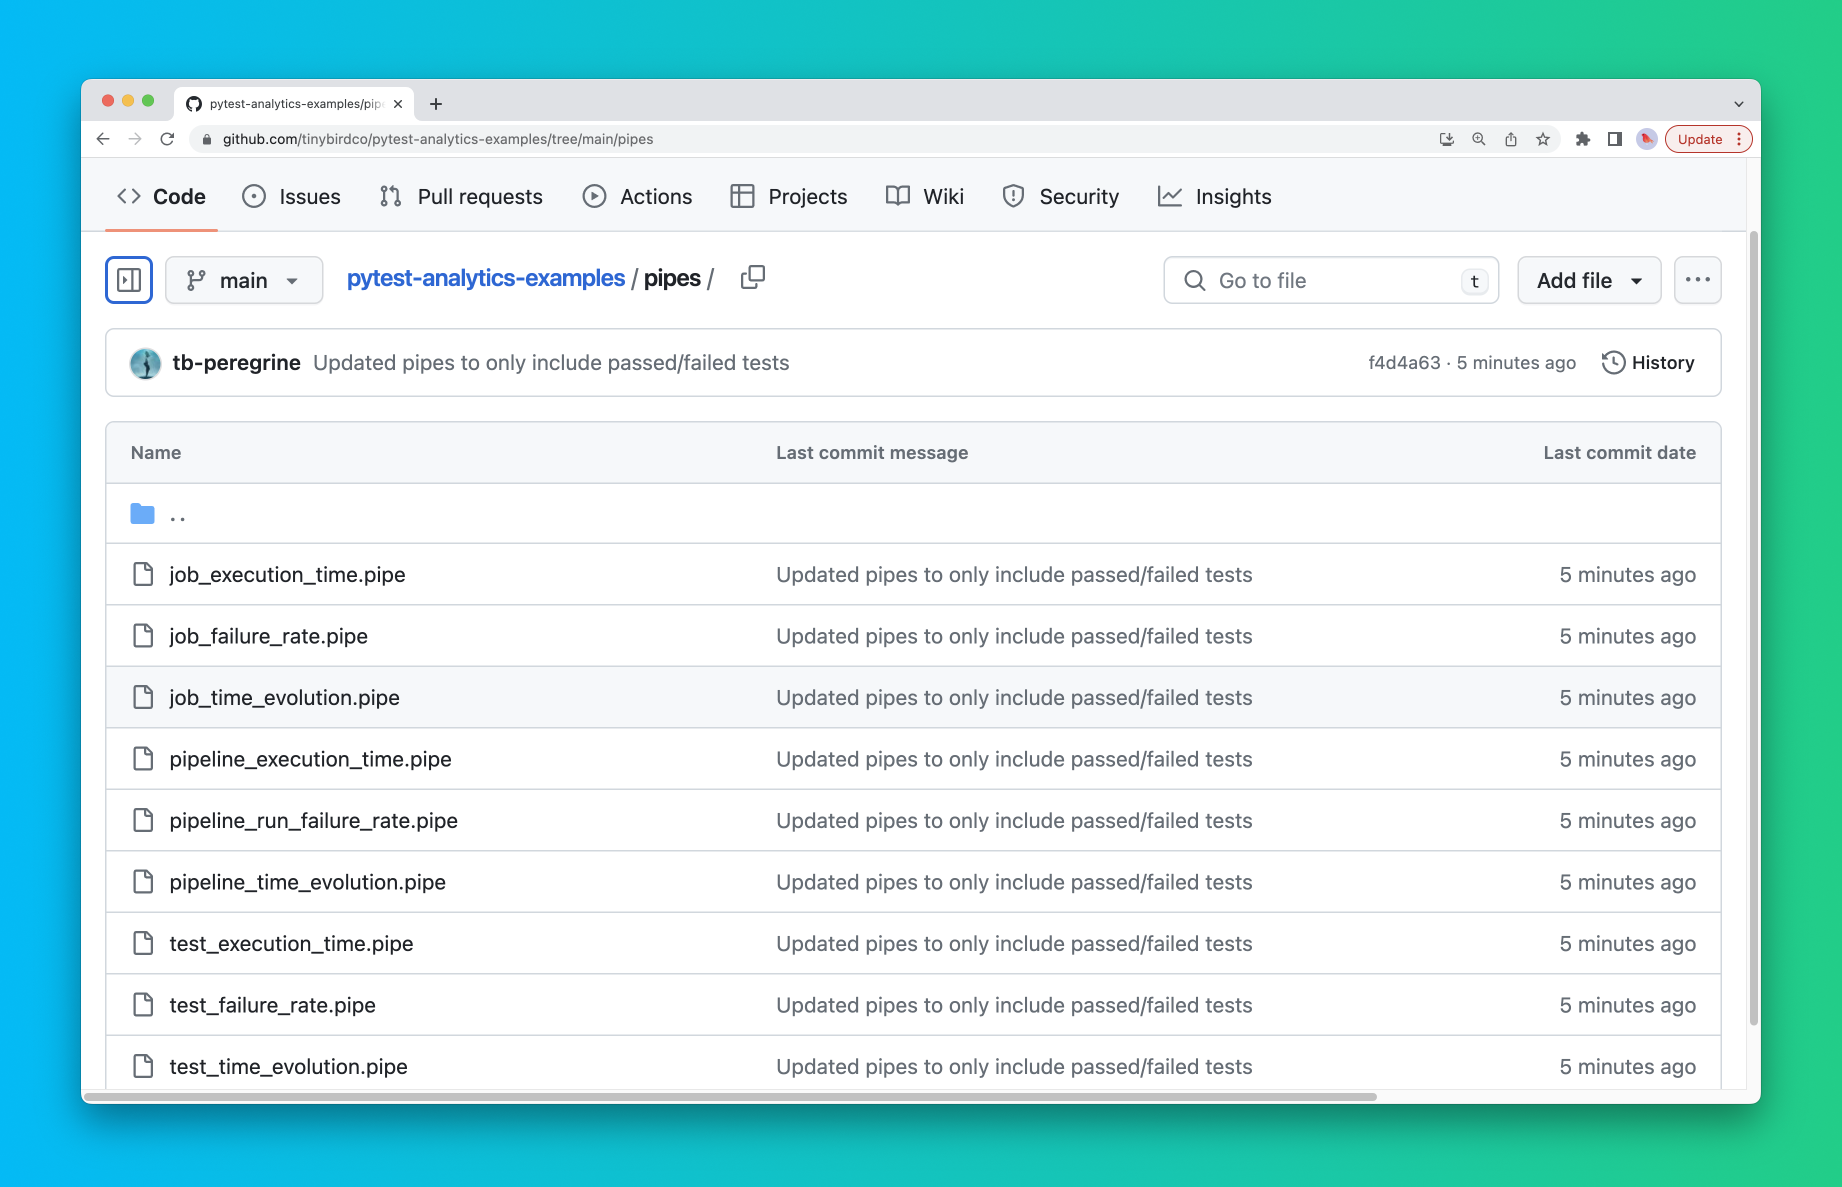
test_reports.To make things easier on you, we’ve created a Tinybird Data Project that already has working SQL for each of these 9 metrics based on the data sent from pytest-tinybird.
You can find the GitHub repository for this SQL here.

To deploy this project, simply sign up for a free Tinybird account, clone the repo, authenticate to your Workspace, and push the resources.
Building additional CI/CD metrics
In addition to these metrics, you can develop additional API endpoints based on your specific needs.
For example, to get a list of the last 100 jobs by start time with their execution time and outcome, you could use the following.
Or, if you wanted to better load balance your tests, you’d need to know which of your tests are the slowest.
Here is an example query that ranks test duration data and lists the ten slowest tests:
Or, suppose you wanted to identify where flaky tests were happening. Here’s an example query that lists the 100 most flaky tests from the last two weeks:
{{}} notation to create a dynamic query parameter for the lookback period. In Tinybird, if you publish this SQL as an API Endpoint, the Endpoint will automatically include a typed query parameter that the user can pass to define the lookback period in days. For more info on Tinybird’s templating syntax, read this.With your pytest data in Tinybird and your Endpoints published, the next step is to do something with that data. Let’s look at how to visualize these metrics in popular DevOps observability tools.
Monitoring your CI metrics in Grafana or Datadog
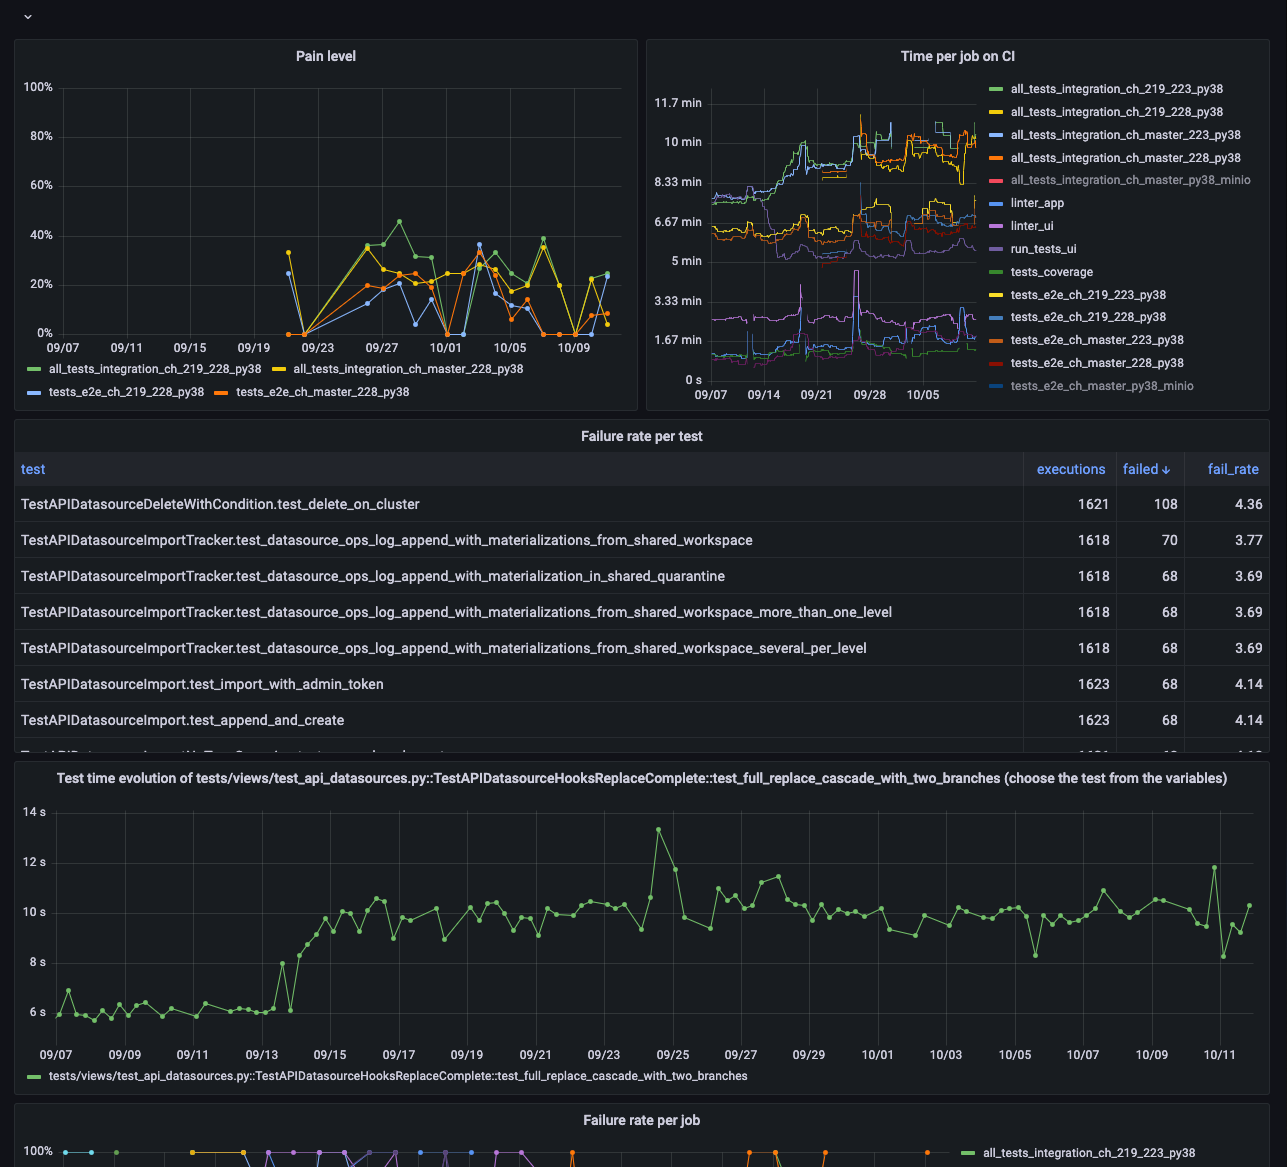
What good is data if you can’t look at it or do something with it? At Tinybird, we use Grafana and the Tinybird Grafana plugin that we recently released to visualize and alert on our critical CI pipeline metrics.

With the charts in this CI/CD observability dashboard, we can continually monitor the health of our CI pipeline, get alerts on anomalous values, and quickly detect any performance degradation.
This becomes critical as we add more and more tests, and continually update versions of our dependencies such as ClickHouse and Python.
We use Grafana to visualize our Tinybird endpoints, but you can use other DevOps observability tools like Datadog or UptimeRobot.
We use Grafana, but any other observability tool that can visualize data from an API could work. For example, we’ve visualized metrics in Datadog using a vector.dev integration.
Automating tests based on APIs
The nice thing about APIs? You can use them for more than just visualizations in a dashboard. In fact, we use them within pytest to override the pytest_collection_modifyitems hook and dynamically order tests based on run time so that the slowest tests run first. Since the API returns in less than 100 ms, it has almost zero impact on our CI pipeline run times, and we have used it to programmatically shave ~10% off our CI time.
We used a Tinybird API to automate our CI pipeline and shave 10% off run times on average.
Getting started with the pytest-tinybird plugin
Want to analyze your CI performance with pytest and Tinybird? Here’s how to get started:
- Install the pytest-tinybird plugin in your pytest environment using the Python package installer pip.
- Create a free Tinybird account and set up a Workspace.
- Set three environment variables in your pytest environment:
-TINYBIRD_URL: For example "https://api.tinybird.co" or "https://api.us-east.tinybird.co" depending on your Workspace region.
-TINYBIRD_DATASOURCE: The name of your Data Source in Tinybird. If this is the first time you’re running the plugin, a Data Source of that name will automatically be created for you.
-TINYBIRD_TOKEN: A Tinybird Auth Token with DATASOURCE:WRITE permissions.
- Run your instance of pytest with the
--report-to-tinybirdoption. - Use the Tinybird UI or CLI to build your metrics with SQL and publish them as API Endpoints.
We’ll continue to evolve this plugin, making it even more robust for CI pipeline monitoring. To stay up to date, you can refer to the PyPi documentation for current and more detailed instructions.
Finally, we welcome contributions to this open source project! If there are there other pytest metadata, such as test configuration and assertion errors, that you would like to include, you can either create an issue in the repo, submit a PR, or let us know in our Slack community (which happens to be a great place to ask questions and get answers about anything Tinybird).
