Outgrowing Postgres: How to optimize and integrate an OLTP + OLAP stack
Navigate the complexities of OLTP and OLAP integration by choosing simple, scalable data movement patterns that reduce infrastructure overhead and keep your focus on building great products for users.

If you've been following along with this series, you've already:
- Pushed Postgres to its data size and concurrency limits
- Learned when it's time to move analytics off Postgres
- Evaluated different OLAP solutions
Now comes the fun part - actually building a hybrid OLTP + OLAP architecture that doesn't make you want to quit programming forever. Because let's face it, while splitting your stack might solve your analytics performance problems, it can also create a maintenance nightmare if you're not careful.
I've helped dozens of teams make this transition, and I've seen some truly... creative approaches. Some were brilliant. Others made me question my life choices. But they all taught me valuable lessons about what works and what turns into a debugging quest that makes Dark Souls look easy.
Let's examine the patterns that actually work, with real examples and code you can use. No buzzwords, no fluff - just practical approaches that won't require a team of 50 to maintain.
Data Ingestion: Getting Data Into Your OLAP System
There are two main ways to keep your OLTP and OLAP databases in sync and like all good computer science problems, we have an off-by-one error in our counting:
- Streaming integration
- Batch integration
- Zero-copy analytics
Each has its place, and deciding which to use depends on your specific requirements for data freshness, operational complexity, and development overhead.
Streaming Integration
When it comes to streaming changes from your OLTP to OLAP database, you've got two fundamental approaches: Change Data Capture (CDC) or Event-Driven Architecture (EDA).
Change Data Capture
CDC captures raw changes from your database in real-time. You've got two main approaches:
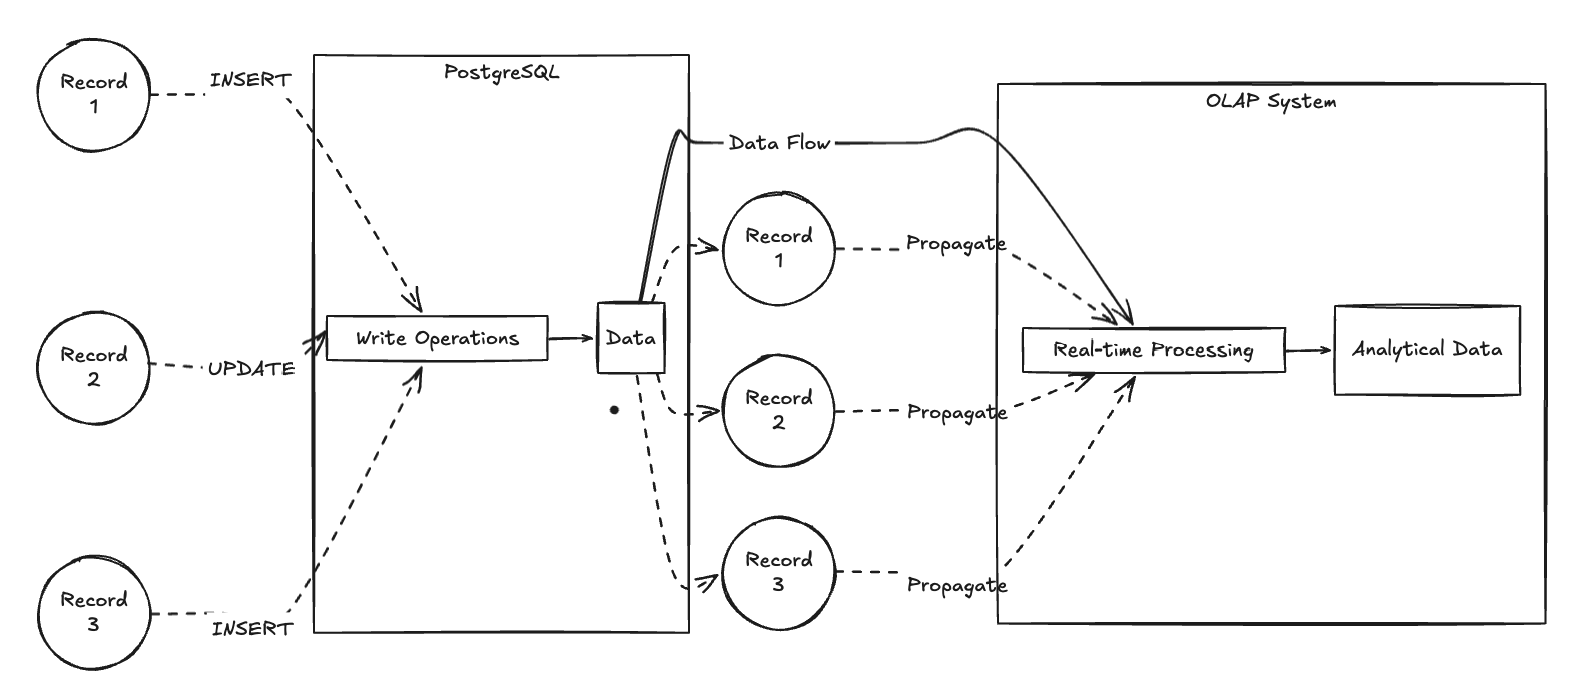
Postgres Replication

The simplest approach? Have your analytics database act as a Postgres replica. This is by far the most reliable method - you're using Postgres' own battle-tested replication protocol. If your target system supports acting as a Postgres replica, this should be your default choice.
For targets that don't support this, you could write your own WAL consumer... but I really, really suggest you don't. Here's what that looks like, just so you know what you're getting into:
Trust me, you don't want to maintain this in production.
CDC Platforms
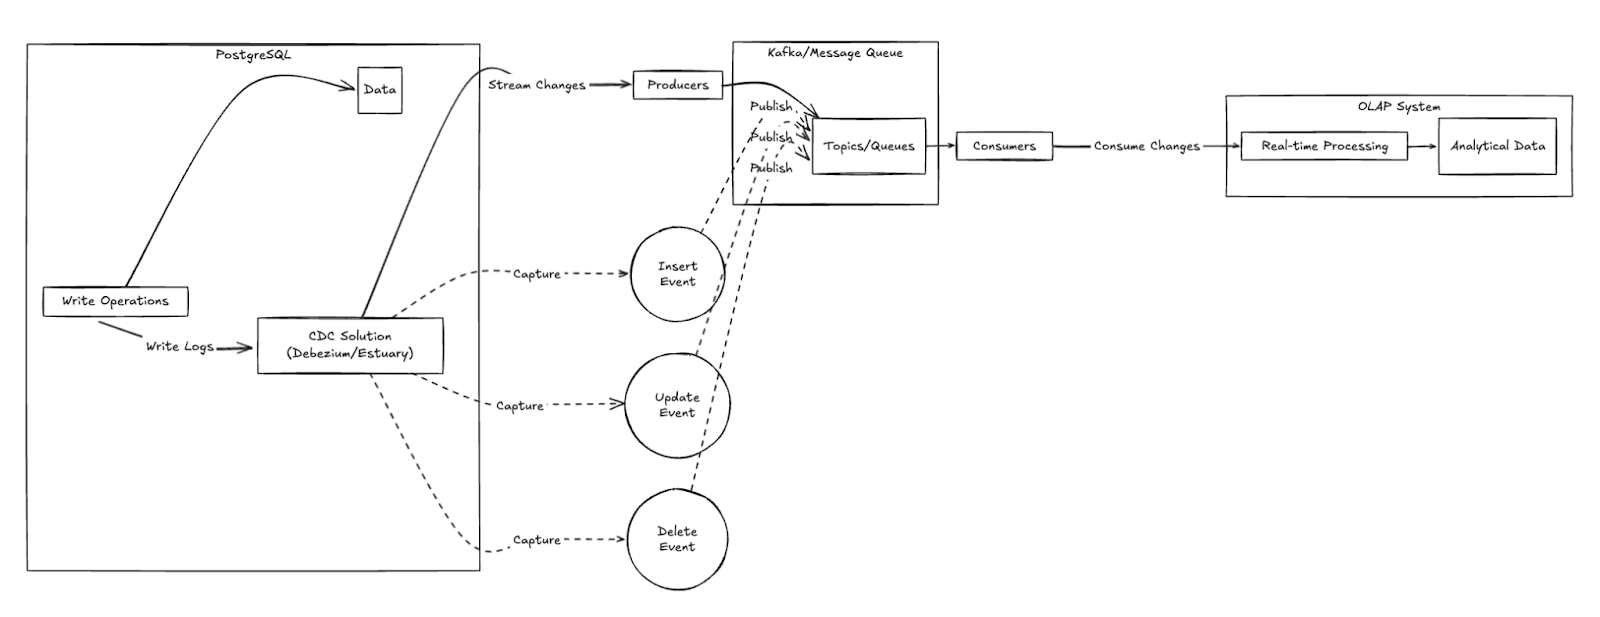
These platforms handle the complexity of reading database logs and managing replication state. Options include:
- Debezium Postgres CDC Connector + Kafka Connect: The open-source standard
- Confluent Debezium PostgreSQL Source Connector: Managed Debezium over Conluent Kafka
- Estuary Flow Postgres: A batteries-included solution that handles the entire pipeline
- Sequin Postgres CDC Webhook to Tinybird: An off-the-shelf solution that streams to Tinybird’s Events API
Event-Driven Architecture
Event-Driven Architecture is a different approach altogether, where your analytics are driven by domain events representing business activities rather than raw data changes. This is common in microservice architectures, but requires more upfront design and application changes than CDC.
If you're already built this way - great! Your path to real-time analytics is much clearer. If not, CDC approaches will be significantly easier to implement and maintain.
EDA generally works in two ways:
Transactional Outbox Pattern
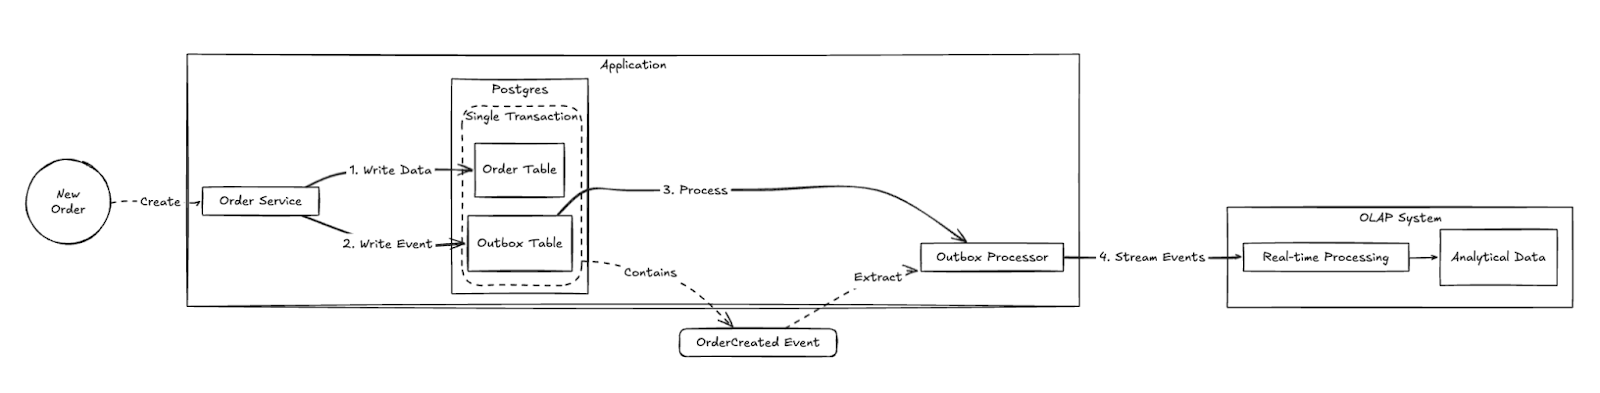
The Transactional Outbox Pattern is a reliable way to publish domain events while maintaining transactional consistency with your database. Here's how it works:
- Every business operation that needs analytics creates domain events
- These events are stored in an outbox table in the same transaction as your main data
- A separate process streams these events to your analytics database
You'll need something to stream these events, either:
- Cloud provider queues (SQS, Cloud Pub/Sub)
- Streaming platforms (Kafka, Redpanda)
- Direct ingestion if your OLAP supports HTTP streaming
Here's a TypeScript implementation that processes outbox events and sends them to your OLAP:
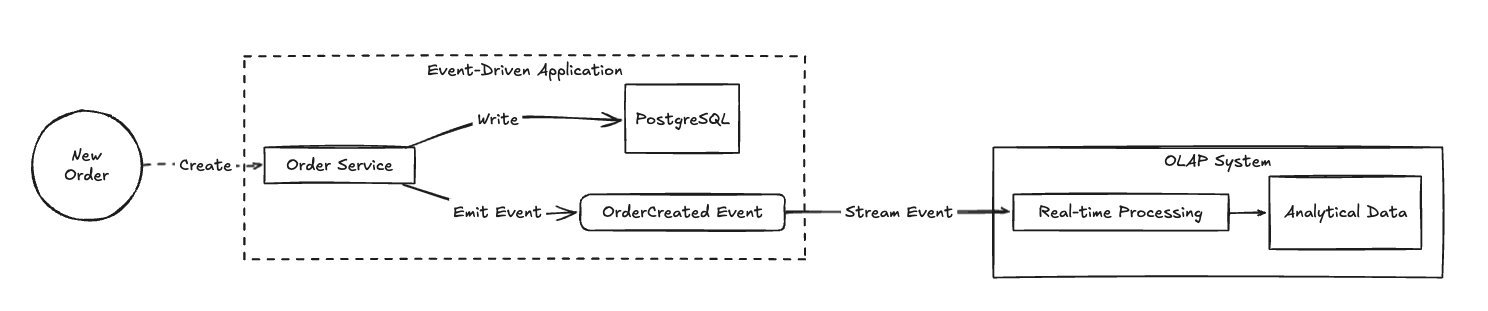
Domain Event Streaming
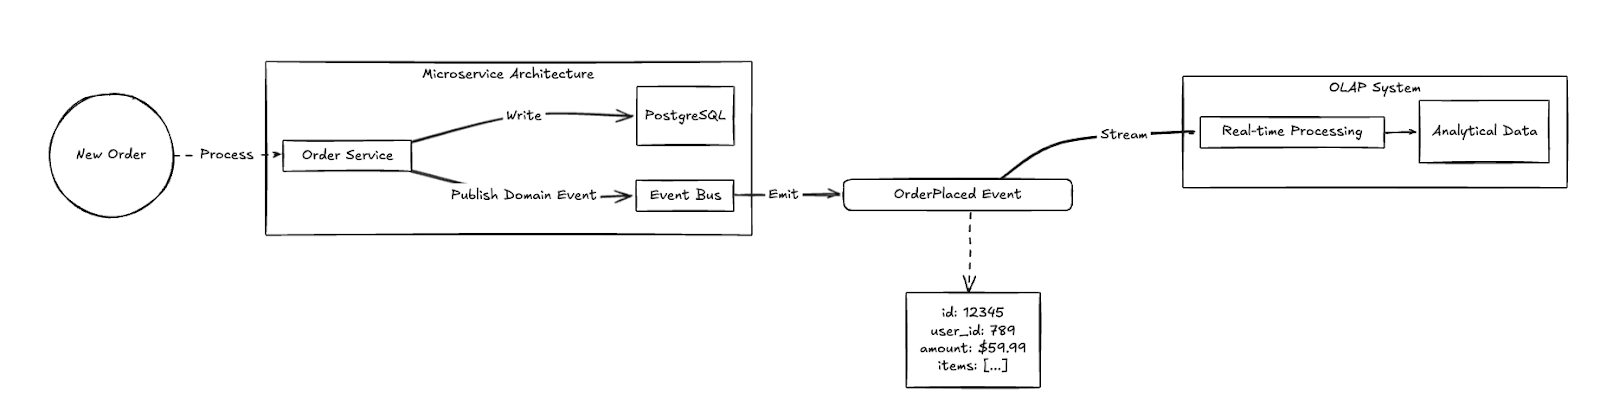
If you're already building with event-driven microservices, you might not need CDC or the Outbox pattern at all. Your domain events can flow directly into your analytics system, giving you rich business context without additional infrastructure.
Here's a Typescript version of that flow:
This approach works best when:
- You're already built on event-driven microservices
- Your existing events contain the business context needed for analytics
- Your event schemas are stable and well-defined
- You have event versioning and schema evolution handled
However, if you're running a traditional monolithic application or service-oriented architecture with a central database, CDC approaches will be much simpler to implement. They require no application changes and can be added to existing systems with minimal risk.
Batch Integration

Sometimes real-time isn't worth the complexity. Batch integration can be simpler to implement and maintain, especially when your analytics don't need up-to-the-second freshness.
Import from Cloud Storage
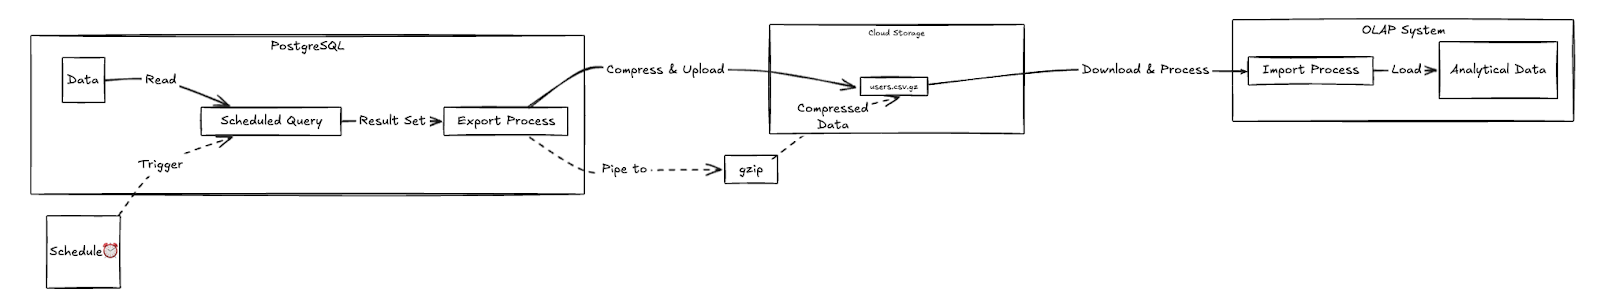
The simplest approach? Piggyback on your existing Postgres backup process. Most teams already run regular backups - you can extend this to include compressed CSV exports for analytics:
Your OLAP system can then import these files on a schedule. Bonus points if it can ingest directly from S3. The beauty of this approach? You're not adding operational complexity - you're just extending an existing critical process.
For more granular syncs between full exports, you can use timestamps:
Pros:
- Leverages existing backup processes
- No new infrastructure to maintain
- Easy to debug (the files are just... there)
- Natural disaster recovery option (you can rebuild from these exports)
- Compression reduces storage and transfer costs
Cons:
- Data latency depends on backup schedule
- Need to manage file cleanup
- Can get unwieldy with many tables
- Storage costs (though you're paying for backups anyway)
Direct Query
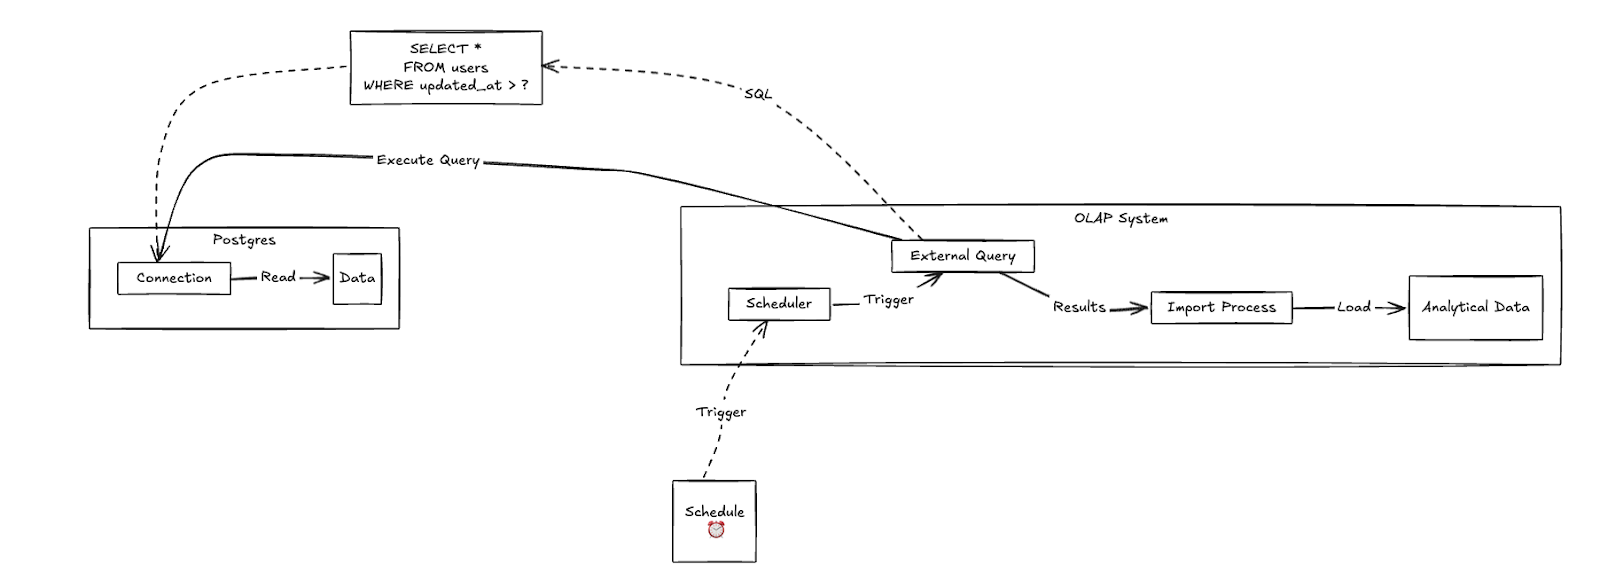
Some OLAP systems can query Postgres directly, treating it as an external table. This can be simpler to set up but requires careful performance tuning. I’ve seen that this works best when you have small (relatively), dimensional tables that don’t change often.
Pros:
- No extra infrastructure needed
- Data is always fresh
- Simple to set up
- No duplicate storage costs
Cons:
- Can impact Postgres performance
- Network costs for repeated queries
- Limited to what Postgres can serve efficiently
- Need careful query optimization
Zero-Copy Analytics: The Promising Third Way
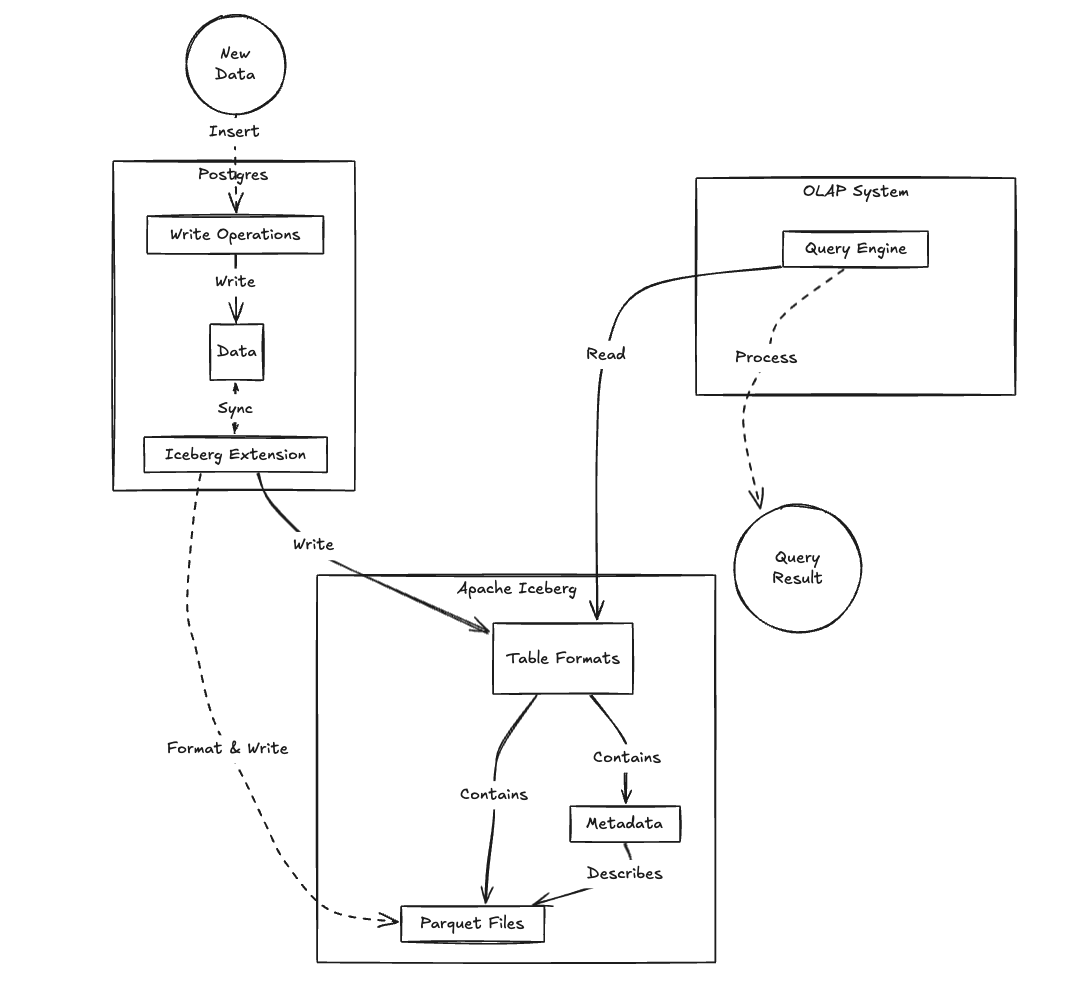
And here's the exciting "third way" that's still maturing rapidly: having Postgres write directly to Iceberg, Hudi, Delta Lake, or XTable which your OLAP system can then read.
With Iceberg becoming the de-facto standard for analytical data and broad support for reading Iceberg tables across OLAP platforms, this pattern could eliminate a lot of data movement headaches. Think of it as the holy grail of OLTP + OLAP integration - the data lives in one place, but can be accessed by both systems according to their strengths.
While this approach is tantalizingly close, it’s not quite production-ready (read: expect some bumps if you try it today). There are projects working on smooth Postgres-to-Iceberg writes, including:
- ParadeDB's
pg_analyticsextension - Various cloud vendor solutions
Example setup using pg_analytics:
Pros:
- Eliminates data copying and sync complexity
- Multiple OLAP systems can read the same data
- Built-in versioning and time travel
- Reduced storage costs
- Simplified architecture
Cons:
- Writing to Iceberg from Postgres still maturing
- Limited production-ready options
- More complex initial setup
- Need to manage lake storage
This pattern is worth investigating if you're already using Iceberg for other data workloads or if you want to future-proof your analytics stack. Just be prepared to be an early adopter for the Postgres write path. Keep an eye on this space - it's evolving rapidly and could fundamentally change how we think about OLTP + OLAP integration.
How to choose Ingestion Patterns
Here's the thing about these ingestion patterns - they're not mutually exclusive. In fact, most production systems use a combination of approaches based on their specific needs.
A typical production setup might include:
- Initial Load: Use batch export to load historical data into your OLAP system. This gives you a stable starting point without overwhelming your streaming infrastructure.
- Real-time Data: Set up CDC or event streaming for tables that need fresh data:
- Order transactions
- User activities
- Critical business events
- Anything powering real-time dashboards
- Dimensional Data: Use simpler approaches for less frequently changing data:
- Product catalog? Direct query might work fine
- Geographic data? Daily batch updates are probably enough
- Configuration tables? Weekly exports with your backups
The key is matching the ingestion patterns to the data's needs. Ask yourself:
- How fresh does this data need to be?
- How often does it change?
- What's the query pattern?
- What's the operational overhead I'm willing to accept?
- How much am I willing to pay for fresher data?
Data Egress: Getting Data Out of Your OLAP System
Once your data is in your OLAP system, you need ways to expose it to your applications, users, and other services. There are several approaches, each with different trade-offs.
API Integration
For these examples, I'm focusing on the core integration patterns and omitting common infrastructure components like API gateways, load balancers, proxies, GraphQL layers, or Backend-for-Frontend (BFF) services. In production, you'd likely have several of these in your stack.
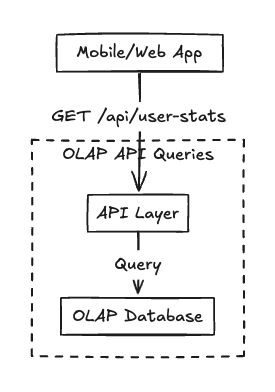
Custom API/Service
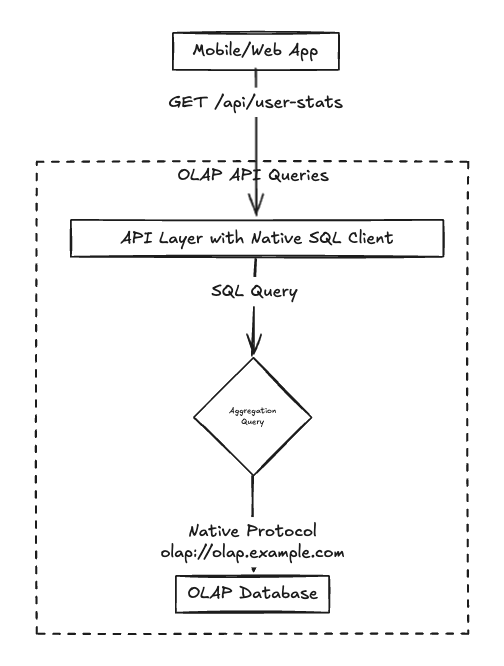
Your API has to construct SQL queries and talk directly to the OLAP database. Oftentimes this is done via an ORM or you just roll your own queries:
SQL-over-HTTP Service
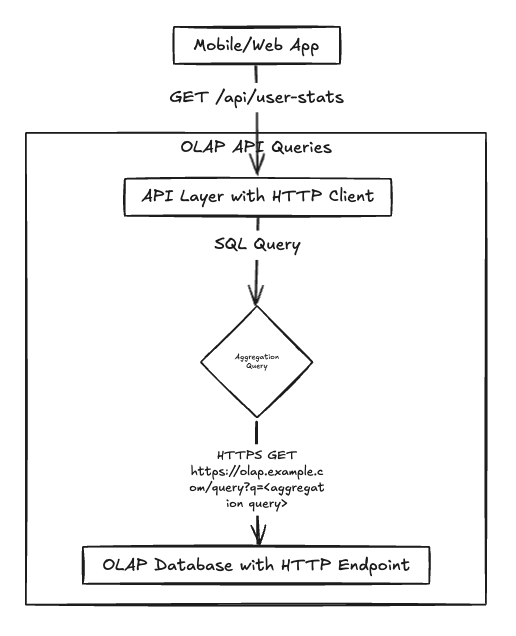
Most OLAP solutions have an HTTP-based query API. This is similar to the first approach above, except that you not longer need to worry about database connections, pooling, etc.:
Native REST API
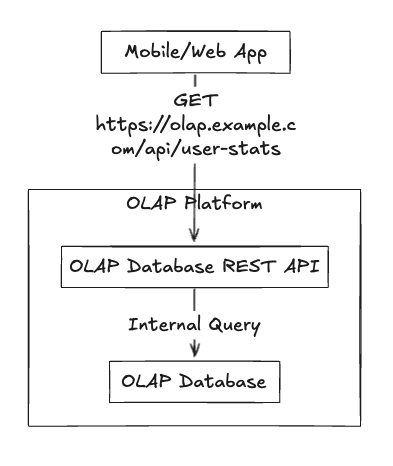
In my opinion, the most developer-friendly APIs expose your queries as full-blown REST APIs and that’s because as I discussed in the previous article, having native REST API support can dramatically reduce the complexity of your analytics stack and accelerate feature development:
Choosing an API Integration approach
- Security: Who constructs the SQL? Who handles authentication?
- Maintenance: How many layers need updating when analytics change?
- Performance: How many hops before getting to the data?
- Developer Experience: How easy is it to add new analytics features?
Batch Export
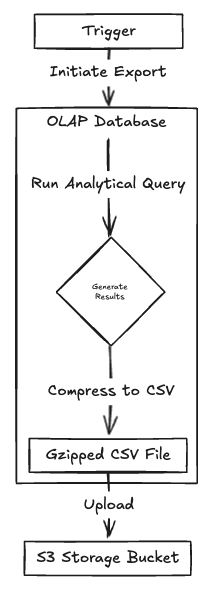
Just as you might batch import data, you can also batch export from your OLAP system. The best solutions here handle this for you meaning, you point it to an S3 bucket and it does its thing. If your OLAP doesn’t support cloud storage sinks, you’ll need to roll your own. Note, if you need to do this often, you’ll likely need a workflow management/job orchestration solution as well:
Common export formats include:
- CSV/Excel for business users
- Parquet/Avro for data engineers
- JSON for application developers
Use cases:
- Scheduled reports
- Data exchanges with partners
- Compliance and regulatory reporting
- Historical archives
Streaming Queries
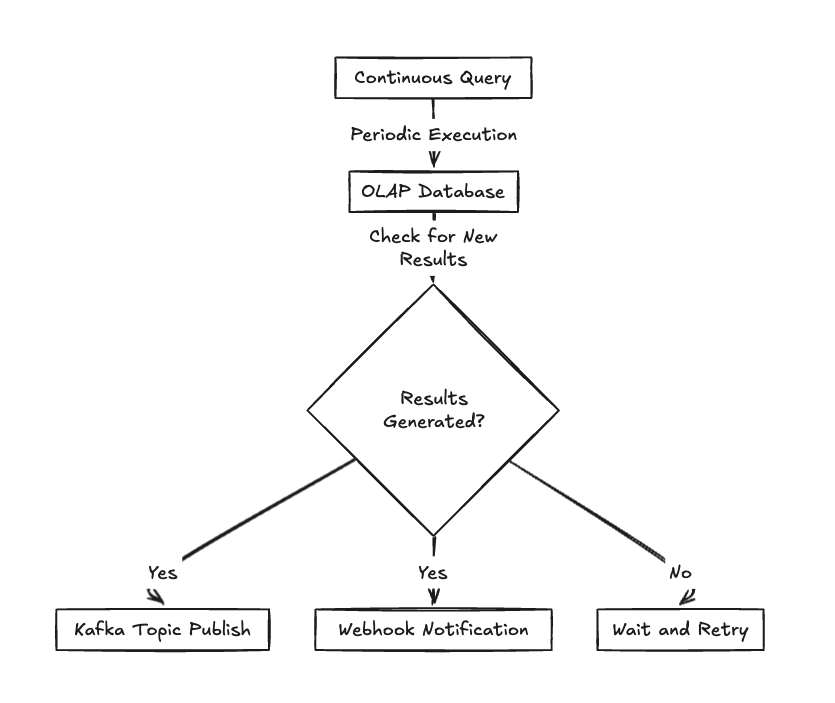
For real-time data pipelines, you might want to stream data out of your OLAP system as it changes. If your OLAP solution supports streaming sinks, whether to Kafka, Webhooks, or a custom streaming protocol, that’s one less (a whole set) of thing(s) to build and maintain.
This is a simple version of what one of those “things” might look like:
This approach is useful when:
- Feeding real-time data to other systems
- Building event-driven architectures
- Implementing webhook notifications
- Supporting real-time integrations
JDBC/ODBC for BI Tools
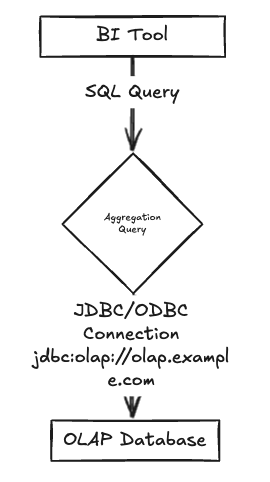
The truth is, once you've moved all your analytics data to your OLAP system, you'll be hesitant to move it somewhere else just for internal users. While your customer-facing analytics might be served through APIs, your internal teams will likely need direct query access for ad-hoc analysis, troubleshooting, and operational support. Generally, your internal teams don’t really care how you connect to your OLAP but unfortunately, many of the tools they use to explore the data require direct database access and have poor support for REST or plain HTTP.
There are also cases where an API just won't cut it - complex exploratory analysis, data validation, or when you need to quickly debug an issue without writing new API endpoints. For these situations, direct database access is invaluable:
Most OLAP systems provide these drivers out of the box. When evaluating OLAP solutions, check that they support the specific BI tools your organization uses.
Considerations:
- Security: BI tools need database credentials
- Performance: Can handle complex analytical queries
- Maintenance: Updates to drivers may be required
- Schema changes: Need coordination with BI team
Monitoring Your Hybrid Stack
When you split your data between transactional and analytical systems, monitoring becomes a critical challenge. No longer are you watching a single database - you're now responsible for a distributed system with multiple potential points of failure and complex data flows.
Imagine this scenario: Your production app suddenly slows down. Is it Postgres struggling with write loads? Has the CDC process fallen behind? Is the OLAP system overwhelmed? Without comprehensive monitoring, troubleshooting becomes a frustrating game of detective work.
A robust monitoring strategy treats your OLTP + OLAP integration as a single, interconnected system rather than isolated components. The goal is to maintain a holistic view that tracks:
Individual Component Health
Every piece of your data pipeline needs its own health check. From Postgres to your CDC process, from message queues to the OLAP system - each component must be monitored individually.
Data Flow Dynamics
Beyond component health, you need to understand how data moves between systems. This means tracking:
- Replication lag
- Event processing delays
- Failed transactions
- Data freshness in your OLAP system
Let's break down the key monitoring areas:
Data Flow Health Metrics
These metrics reveal critical insights:
- How quickly are changes propagating through your system?
- Are there bottlenecks in your data pipeline?
- What might be causing potential performance issues?
Warning Signs to Watch:
- Postgres experiencing heavy write loads
- CDC process running out of resources
- Large transactions blocking replication
- Network connectivity problems
- Potential backpressure in the system
System Resource Monitoring
This approach helps you understand:
- Impact of analytics on your core application database
- User experience across dashboards and applications
- Potential scaling requirements
Red Flags:
- CDC consuming excessive resources
- Analytical queries bleeding back into OLTP
- Resource contention between systems
- Data hotspots
Unified Monitoring with Prometheus
Prometheus offers a powerful way to create a unified view of your entire analytics stack. By collecting metrics from each component, you can build a comprehensive monitoring solution.
Example Metrics to Collect:
Recommended Grafana Dashboards:
Data Flow Overview
- Replication health
- Event processing rates
- Lag and latency metrics
Query Performance
- OLAP query latency distribution
- Active query counts
- Query type breakdowns
Resource Utilization
- CPU and memory usage
- Connection pool statistics
- System-wide resource consumption
Key Benefits:
- Single monitoring interface for your entire stack
- Standardized alerting configuration
- Rich ecosystem of monitoring tools
- Easy correlation between system components
Pro Tip: Most modern OLAP systems expose Prometheus metrics out of the box. If yours doesn't, you might need to develop custom exporters or explore alternative monitoring solutions.
One last consideration: The Complexity Tax of Distributed Systems
Here's an uncomfortable truth: Every component you add to your data stack introduces a new potential point of failure. Need an API layer? Now you're not only building, deploying, and managing it, but you’re also monitoring its performance, error rates, and response times. Require a separate ingestion service? Add iterating, deploying, running, and monitoring for its resource usage, processing delays, and error handling to your workload. Implement a job orchestration system? Again, you have to continually build it and operate while also tracking job schedules, success rates, and execution times.
It's what I call the "complexity tax" - and it's brutal for small teams. Each new piece of infrastructure doesn't just add capabilities; it multiplies your development, monitoring, and maintenance overhead. A simple two-component system might require basic monitoring. Add five more components, and suddenly you're managing:
- Connection pools
- Error rates
- Latency between each hop
- Resource utilization for each service
- Networking and bandwidth constraints
- Authentication and authorization at each layer
- Potential cascading failures
This is precisely why I keep harping on the value of minimalism. The fewer moving parts, the less there is to monitor, debug, and potentially break. When evaluating any new component or integration pattern, always ask: "Is this complexity worth the marginal benefit?" More often than not, the answer is no.
Wrapping up: Integrating OLTP and OLAP Effectively
We've covered a lot of ground in this series on Postgres and analytics. From identifying early warning signs to choosing the right OLAP solution, and now to integrating the two worlds effectively. Allow me to wrap up with some final thoughts.
Key Principles for Success
- Start Simple, Scale as Needed
- Begin with the simplest pattern that meets your needs
- Add complexity only where it provides clear benefits
- Mix approaches based on data characteristics
- Remember that perfect is the enemy of done
- Match Integration Patterns to Data Types
- High-volume transactional data? CDC or event-driven
- Slower-changing reference data? Batch or direct query
- User-facing analytics? Optimize for query speed
- Internal reporting? Optimize for operational simplicity
- Minimize Moving Parts
- Each component adds operational burden
- Choose patterns that reduce maintenance
- Consolidate where possible
- Consider managed services to reduce overhead
- Plan for Schema Evolution
- Choose patterns that make schema changes easier
- Document how changes propagate through your stack
- Test schema changes thoroughly
- Have rollback plans for schema migrations
- Monitor the Entire Flow
- Track data freshness end-to-end
- Watch for bottlenecks and resource contention
- Set alerts for integration health
- Create dashboards for the full stack
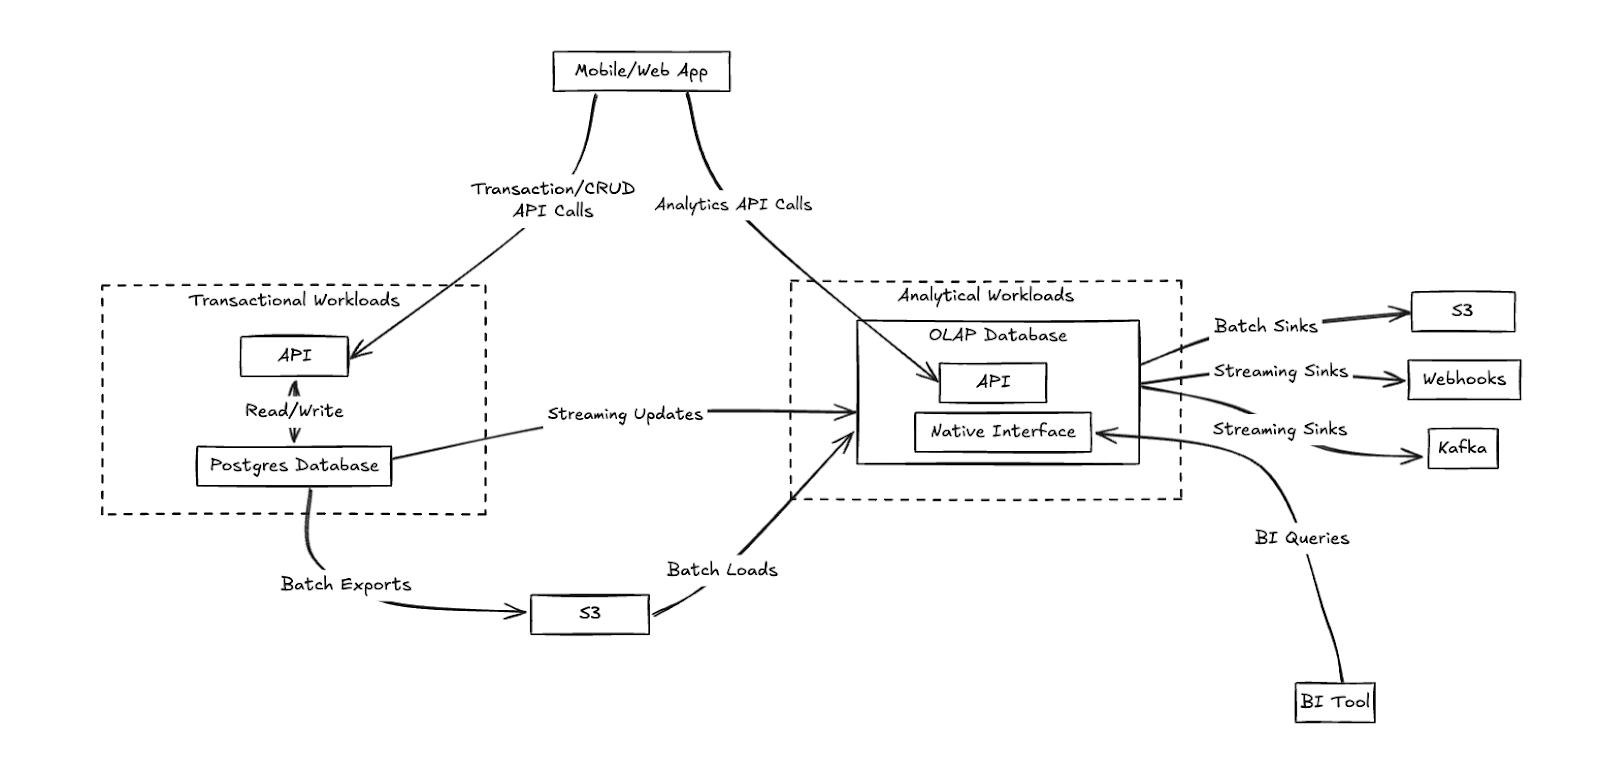
What does my ideal architecture look like? Something like this:
The Path Forward
The world of OLTP and OLAP integration continues to evolve. Newer patterns like Zero-Copy Analytics with Iceberg show promise for further simplifying these architectures. The future likely holds more native Postgres integration with analytical engines, making these hybrid stacks even easier to build and maintain.
For small teams, my advice is simple: start with the patterns that minimize complexity and maintenance burden. As your needs grow, you can always add more sophisticated integration approaches where they provide clear benefits.
Remember that your ultimate goal is to build products that delight users, not to maintain complex data pipelines. Choose the integration patterns that let you focus on what matters most - delivering value to your customers. I hope you’ve enjoyed reading this series as much as I’ve enjoyed writing it. It’s been a fun journey. Thank you for riding along with me!
Need to move your analytics off Postgres?
Tinybird is a real-time data platform optimized for low-latency, high-concurrency analytics. You can query your Postgres tables with SQL and publish queries as dynamic, scalable REST API Endpoints to power in-product reporting, real-time dashboards, and more.
You can try Tinybird for free with no time limit. Sign up here