I've helped huge companies scale logs analysis. Here’s how.
I've spent years optimizing logs explorers across multiple domains with trillions of logs to process. Here's what I've learned about building a performant logs analytics system.

Storing and searching logs is a problem as old as software. Many tools exist to do it. It's solved. But this post focuses on a different problem.
What if your users want to explore the logs? What if you have billions of logs?
Fundamentally, this is a problem of scale in multi-tenant architectures. It's something that Vercel most solve with runtime logs, for example.
Here, I share some things that my teammates and I have learned from working with massive amounts of data from multiple domains over the last years, and that I think could be useful if you're building something similar.
If you are reading this, you might know that Tinybird is a platform designed from the ground up to handle scale, and it is used every day in the real world for solving some of these problems (Vercel Observability, for example, is built on Tinybird).
In this post, however, I will try to focus on the technical challenges of storing and retrieving logs in multi-tenant, user-facing systems and how to solve them in a tool-agnostic way. If you are interested in a complete Tinybird implementation of these principles, check out this multi-tenant logs analytics template.
Ingestion: How do I get logs from my application to my analytical system
When building log analytics (regardless of scale) the first challenge you are going to face is getting your logs from where they are generated, to where they are stored and ultimately analyzed. I am going to go over a few options that range in complexity, so that you can evaluate what solution best fits your needs.
Option 1: Just Log to Log
This is the simplest approach where applications directly write logs to a log management system. The application is responsible for log formatting, buffering, and delivery.

This approach is suitable for simple applications with moderate logging needs and where operational simplicity is a priority.
It's a simple, cost-effective approach with no additional infrastructure required. However, it may have some limitations in terms of scalability and observability.
Option 2: Log to Log with a Sidecar
This approach involves deploying a sidecar container/application alongside your application that handles log collection and forwarding. The sidecar is a common architectural pattern in microservices where a helper container is deployed alongside the main application container.
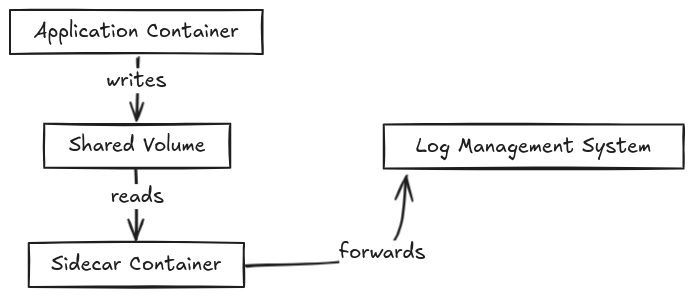
Components
- Application Container
- Writes logs to stdout/stderr or files
- Shares a volume with the sidecar container
- Requires minimal changes to application code - Shared Volume
- Mounted by both containers
- Acts as a buffer for logs
- Can be configured for size limits and rotation - Sidecar Container
- Runs logging agent (e.g., Fluentd, Filebeat, Vector)
- Reads logs from shared volume
- Handles log processing, enrichment, and forwarding
- Can implement retry logic and buffering
This solution is suitable for applications that are already containerized and where you want to avoid changing the application code.
Option 3: A hybrid approach
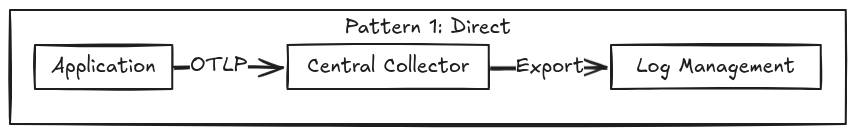
A hybrid approach can work in multiple ways:
- Direct mode: Applications send logs directly to a central collector.
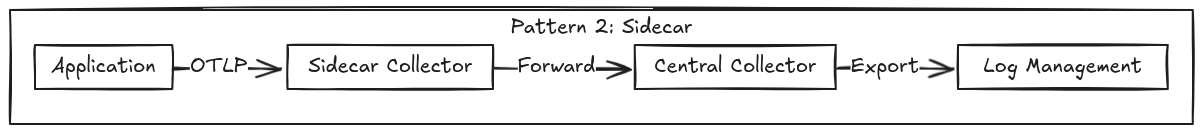
- Sidecar mode: Each application has its own sidecar that sends logs to a central collector.
- Gateway mode: Applications send logs to a gateway that forwards them to a central collector. Useful for multi-region deployments.

This approach lets you start simple (like Log to Log) but gives you the flexibility to evolve to more complex patterns (like sidecars or gateways) as your needs grow, all while using the same core technology.
I won't tell you how to do any of this exactly for your specific application, but if you do intend to use Tinybird to store and analyze logs, we have a few useful guides on how to ingest data from tools like Vector.dev, AWS Kinesis or GCS Pub/Sub (or you can take a look at a bunch of ingestion guides for the one that might fit your needs better).
Storage: How do I handle multi-tenancy?
In this context, multi-tenancy is a common scenario: You have an app or system that provides a service to many different users, and you need to ensure that each user’s log data is only served to them. This may seem to be a retrieval problem more than a storage problem, but as with most data problems, it starts with storage.
Replicate your infra for each client?
The most obvious way to ensure client separation is simply replicating the architecture of your system once for each client. This comes with a notable downside: inefficiency. You need to dimension each one to accommodate for the particularities of the load of each client, which can be a problem, especially if your SLAs call for a stable service during load spikes.
Separate storage and compute?
Another option would be to separate the compute and the storage, re-using the same compute capacity for all of your clients, and storing their data separately. This can be done at many levels, but in practice, it often means sending each client’s data to a different table in your DBMS.
And this could be a practical solution, but given enough clients (scale strikes again), you might find yourself with millions of different tables each using the same structure for their logs. DBMSs tend to not like having that many tables.
Keep all your logs in one table
Finally, another solution (and the one that usually makes the most sense) is to keep all of your logs in the same shared table and identify each log with a unique id for the client that generated it. That way, when you read a log, your system knows exactly to whom it can and can not send it to.
This solution does not have the same table scalability problem as before, and now you are only limited by the amount of rows/logs that your DBMS can reasonably handle given your needs, i.e. how fast do you need to retrieve your data (hint: nobody likes “slow”).
But you have to be careful about something. If you put all clients' data in one table, you swap one problem for another. Storage becomes simple, and retrieval becomes complex. Imagine that client “A” sends a request to your system, and it needs to read some of their data. If you don't use any special strategy to index the data, you would need to go through each log and check that the owner matches your query for “A”.
This means that the query has an algorithmic complexity dependent on the total number of logs that you have. Since all your clients’ logs are in the same place, and you have to scan every log to identify what belongs to whom, a client with 10 logs would take a similar amount of time to perform the query as a client with 10 billion logs (and neither of them would be happy).
This is where you could think about indexing the data based on the client. This would probably make things better, depending on the distribution of your data, but the reality is that your index is going to have to be very big, as it needs to point to every single log that belongs to every single user. Ideally, a reference to where the data is stored is smaller than the data itself, but you still need to run that on a computer, and that means going to storage, retrieving some logs, going to some other section of the storage, retrieving some logs, and repeat until you are done for the client. On a big enough scale, this is not going to cut it either.
So how could you make this more efficient? Well, a good solution would be to organize your data in a way that all of a client’s logs are close to each other on disk, which has 2 implications:
- First, you do not need to store a reference in your index to every single line for each client, you just need to know where their data starts, and the rest should be next to it (until you get to the “next” client), so your index is now as big as the number of clients that you have (and therefore efficient at much greater scale)
- Second, information retrieval from storage is more efficient if the data that you are looking for is contiguous. In this case, you've essentially solved the problem. The algorithmic complexity of the log retrieval is (almost) independent between your clients.
Now, I'm not going to go into detail about how to implement this on multiple systems, but I will mention that this is really easy to do with Tinybird. Tinybird uses columnar storage; you can set the way that your data is indexed and sorted (i.e. organized) in storage by a particular column (in this case the client's unique id), and use row-level security policies so that when you retrieve a client’s data, the system only needs to go to the index, see where the data for that client starts and ends, and get it from storage in one go.
Retrieval: How do I filter to give my user a quick glance of their logs?
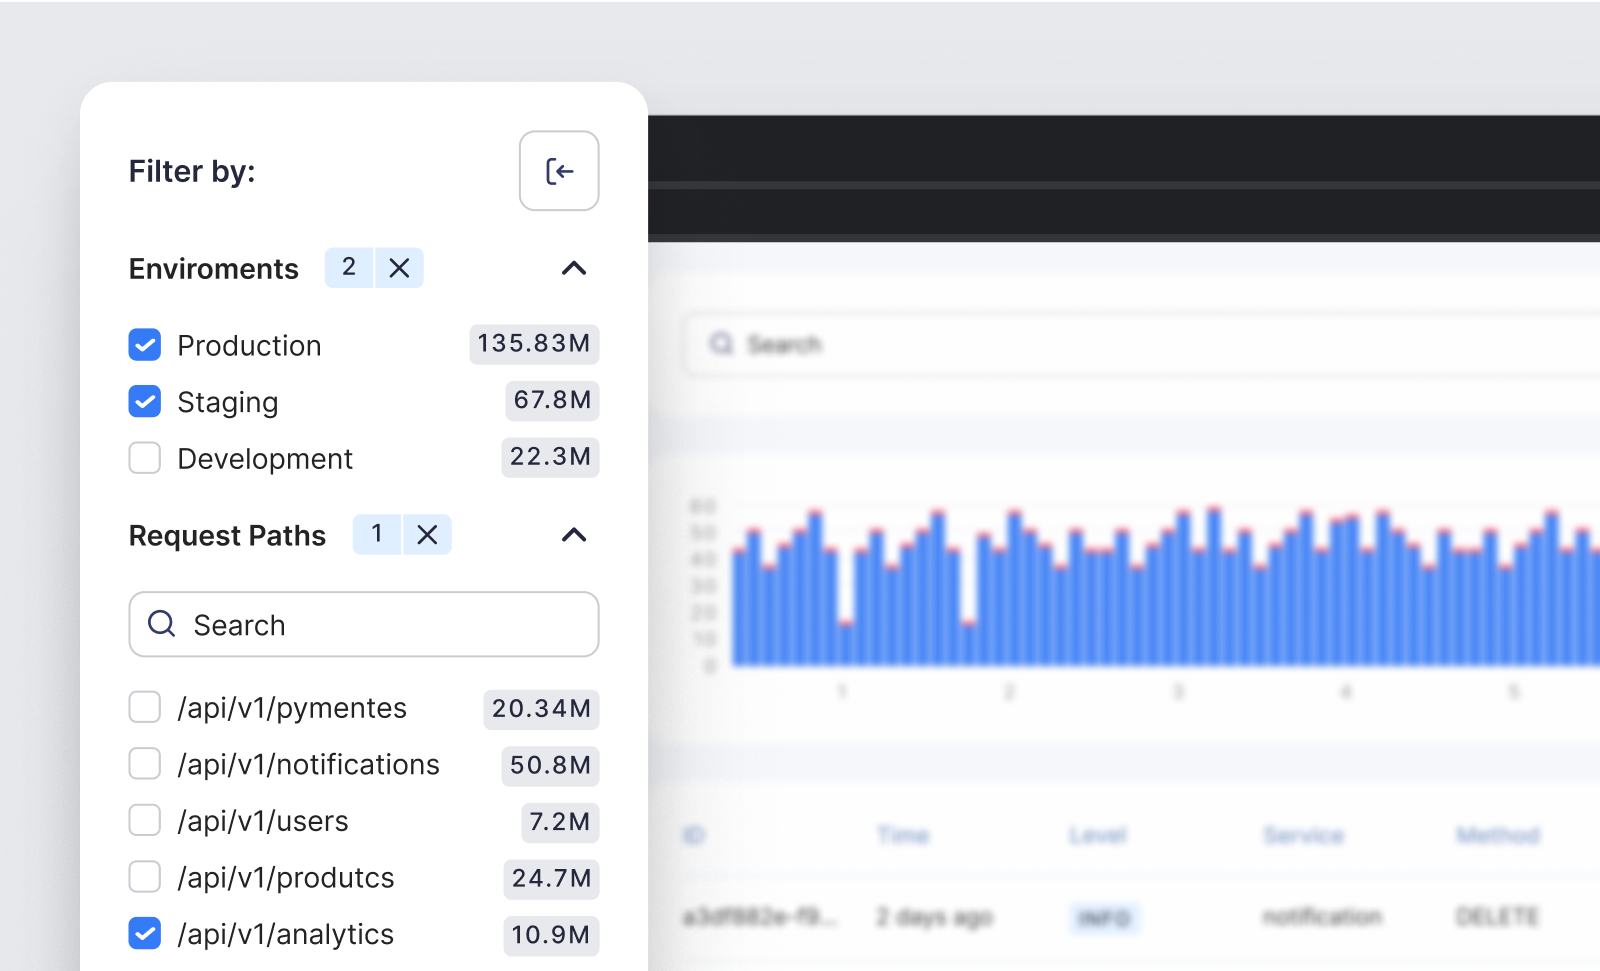
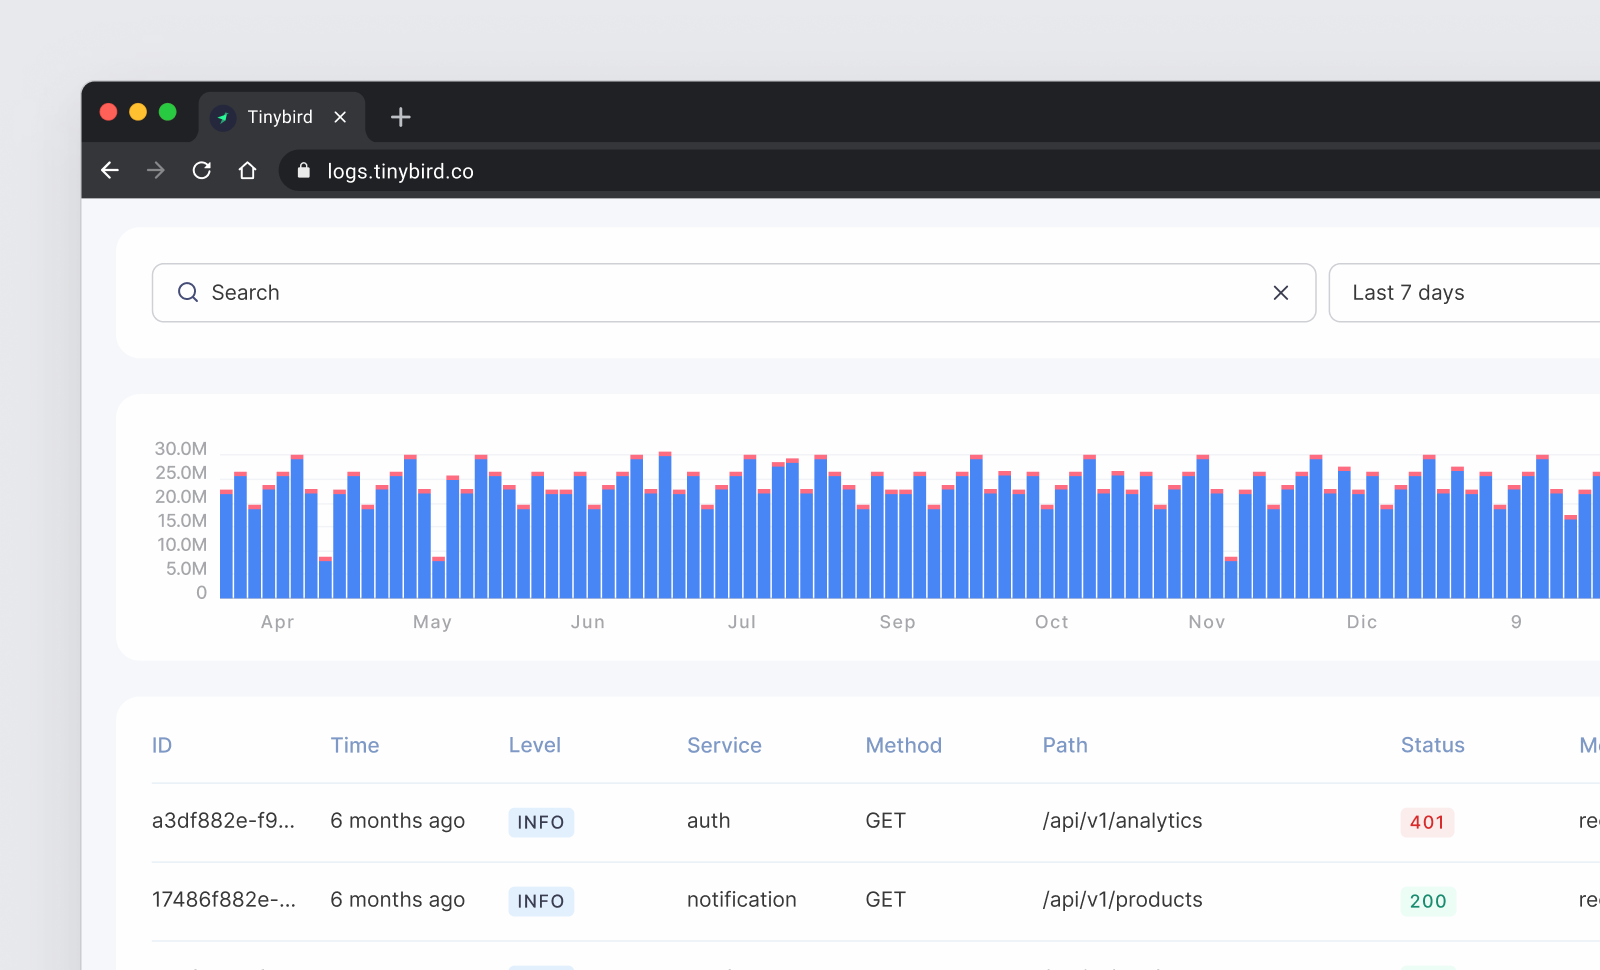
The problem of logs retrieval in a multi-tenant system is a very practical problem that anyone looking at logs faces. When you are exploring your logs, you do not usually want to just read them one by one; it would be way too much for a person to process.
Instead, you probably want to quickly see stuff that can give you high level view of what your system is doing, like “How many log lines for the different levels (e.g. DEBUG, WARNING, ERROR) do I have?” or “How many 200s has my service returned” to get some sense of the usage that it is getting, or “How many 500s has my service returned” to identify any problems. Or even more complex stuff, like “What path from my website is the most popular/ generating the most errors?”.
How do you do this? Generally, it starts by defining a time range to look for the logs, for example, the last 7 days (usually the freshest data is the most relevant). And then, for that time range, you want to provide some view - a chart or list - that answers questions like those above.
The most direct way to calculate these metrics is to get them on the fly - to query the underlying logs storage table and pass all the filters and aggregations in the query. However, scale is here to ruin your solution yet again, and there will be a point where doing this every single time that you need those stats is not practical, performant, or cheap.
Pre-calculate your aggregates
So here's another trick: pre-calculate those stats beforehand. Now I can hear you say, “but I do not know the exact time frame that my user will want”, and thus, you can not get the exact pre-calculated values. However, not all is lost.
The simplest approach is to pre-calculate aggregations over arbitrary time windows, and use that to calculate the stats on the time window that we want to show our user. This can be as simple as calculating daily totals (this is called rollups), and when your user looks at a 7 day time-frame, you take your 7 pre-aggregated daily values, sum them, and – voilá – you’ve got your fancy stats.
Now, the number of values that you have to read to get the total does not depend anymore on the number of logs in your system, but only on the aggregation window that you choose and the time frame that your user wants to retrieve.
In the last 7 days example, you'd need to read just 7 values regardless of the actual number of rows that you are counting. You could have a trillions logs every day, but you'd read 7 values, not 7 trillion. 🤯 This is what we call scalability!
But, there is a caveat: What if the time window that your user is looking at does not exactly match the start and end of the aggregation window that you have set? Imagine that you have the total number of logs for each combination of log level, status code, and website path, per day, but your user happens to be looking at a time frame from 2025-02-10 12:00:00 to 2025-02-13 12:00:00. You do not have the aggregated values for 12 hour intervals, so you can not give an accurate answer.
You have 3 options here:
- Ignore the problem and hope that it goes away. Depending on your application, you may not need to give an accurate answer. Imagine that you are looking at 200 days of data; do you really care that the values for the first and last day are a bit off? Maybe you do, but if you do not, problem “solved”. However, if you must be more precise…
- Be smarter with your time windows. I suggested having an aggregation per-day, but maybe the graphs that you show your users aggregate the data per-hour by default because otherwise the users see too many points and the graphs would get too busy.
This is just an arbitrary design choice, you can pre-aggregate on a smaller time window and adjust your graph filters such that the smallest aggregated data point that you show can be calculated exactly.
You also have the option of multiple pre-aggregation levels, where you can use one or the other (or a combination of both) to always deliver precise results in a scalable way. But, if you really do want to provide precision down to the millisecond… - Combine pre-aggregates with raw queries. The problem with pre-aggregating the data at a certain arbitrary level (e.g. daily or hourly) is that there will be some queries that you can not calculate exactly. If a user can select a smaller granule time window, those bits at the end will not be properly accounted for.
However, that is only problematic when you restrict yourself to using only pre-aggregated values. But that's an arbitrary restriction. You can combine pre-aggregates and raw logs!
For example, if you want the total count of logs from2025-01-01 12:00:00to2025-01-31 12:00:00, and you have data pre-aggregated per day, the counts are going to be correct from2025-01-02 00:00:00to2025-01-30 00:00:00. It's only in the remaining 12+12=24 hours that have an error.
To solve this, you can get what you know is accurate from the pre-aggregated data, and calculate the rest on the fly. This way, you can have the highest possible precision while significantly improving the efficiency of the solution. In the previous example, you would be counting about 24 hours of raw data, while reading the rest from the pre-aggregation (just 29 rows more).
In short, for maximum efficiency, pre-calculate what you can, calculate on the fly what you can’t, and merge the data. Also, approximate as much as you can get away with. In the end, these approaches enable a much more efficient and quick log exploration experience, depending on your needs for precision. I always offer the reminder that not everything requires perfect precision; when you are looking at 300 days worth of data, your decision making is not very likely to be affected by a <1% difference.
Optimization: Reducing log retrieval latency
Bear in mind that this optimization is a bit more specific to Tinybird and similar columnar databases, but it’s a good thought exercise in any case (and there's a strong argument that you should be using such a database for this use case anyway).
Imagine the same situation as in the last section: your user is exploring some logs, and they want to retrieve all logs for a relatively long period of time, say, all of 2024. That's logs from 2024-01-01 00:00:00 to 2024-12-31 23:59:59.
Assume for that period they have 10 million rows per day, so the total amount of rows is 365*10 million = 3.65 billion rows of logs.
You also want to retrieve these logs in order, with the latest logs first, so you send a query to the database and away it goes to fetch the logs. The system will attempt to read 3.65 billion rows, order them (if the data is already pre-sorted by timestamp, this isn’t such a huge task), and return the logs to your front-end so you user can explore their full year of logs.
If you did the above, the reality is that your user would be waiting for a while, and then something would fail, because you are trying to shove 3.65 billion rows of data through a magic cable from your server to the client’s front-end. Besides, stop and think. What would be the point of showing a human 3.65 billion logs? Realistically, a human can't process more than a few dozen or hundreds of logs in a short amount of time. That's why we electrified rocks in the first place: to process things for us.
In order to avoid this problem, you have a nifty mechanism called "pagination" to limit the amount of data that we need to move around at a time. This can be done at the server or at the client level (or both). However, I am most interested in talking about server-side pagination, where the front-end will only request a portion of the data, usually something that can be reasonably used in a single view. Then, the frontend retrieves more data over network only if the user requests more data.
This is actually a great principle to keep in mind for data engineering (and optimization in general); only read what you actually need. Always think about what results you are going to actually display to the user and fetch the least amount of data that you need to calculate those results.
So, the solution is simple, right? You can just slap a LIMIT page_size OFFSET page_number*page_size (or whatever mechanism your database uses for limiting the number of results) and pat yourself on the back, right?
Maybe in some cases, but generally, no. One of the reasons why Tinybird (and many other columnar/OLAP databases) is so fast is that it does not just read data sequentially using a single thread. Rather it uses a whole pool of threads that split up the range of data that they each have to read, and start working.
However, since with pagination you only want to get a small subset of rows, let’s say 100, you add a LIMIT 100 in the query that indicates that as soon as you have 100 rows, the database can stop reading.
This creates a problem for a multi-threaded database. Each thread could know what time range it has to scan, how many rows it has read so far, and how many rows it has to get at most (100). However, each thread does not know how many rows the other threads have, and also, if their data has the most recent 100 rows, which is what we are after. So what happens in practice? Each thread reports their rows, and then all of the data has to be gathered and processed further in order to figure out the actual result of the query. So in the end, you are reading a bunch of data over the whole requested period, only to discard most of it.
So what is the actual problem here? I'm framing this problem as “I want the latest 100 logs from 2024," but that isn't the database way to think about it.
If you remember from the previous section, I was talking about having pre-aggregated stats from past data over arbitrary time windows. You could apply this principle to count how many logs you generated over such a time period (disregard for extra dimensions like logging level, status, etc., though the same can be applied with a little more logic).
You can use this information to re-frame the LIMIT question. The cause of the inefficiency in a multi-threaded query engine is that you do not know what period will contain the 100 rows that you want beforehand. If you generate 1 log per second, you'll need to fetch the last 100 seconds. If you generate a million logs per second, you only need to fetch the last 0.1 ms. If your DBMS doesn't have this info, each thread has to read a bunch of data in hopes that it will find the right logs.
However, you know how many rows each day has – you've pre-aggregated them! – so you can calculate how much time in the requested period you would need to read in order to find your 100 rows. In other words, you have a “map” of how many rows you have each time period, so when you ask your database to get the latest 100 logs from 2024, you can translate that to “Retrieve only the data during this time window - that will be enough to give us the 100 logs”.
If you're generating about 10 million rows per day, you can easily find the last 100 logs in a single day, and you can re-formulate the query to “Select the latest 100 logs from 2024-12-31” . In fact, since you're generating over 100 logs per second in this case, you could even retrieve just the last few seconds (if you are pre-calculating per-second aggregates), but even fetching just a day or an hour would massively improve things.
The short version: again, keeping a few pre-computed stats of your logs can be useful. In case you are wondering, I'm not going to tell you how you can pre-compute your stats; that is going to depend massively on your toolset. But what I can tell you is that doing it using Tinybird is really simple, you can take a look at it in this log explorer with Tinybird demo repository or the log analytics template that can be deployed to Tinybird + Vercel, and implement these solutions for yourself.
Bonus: Text search over logs
Another really valuable feature that users might want in a log analytics solution is free text search. Honestly, this is a pretty difficult problem, and there are not that many ways to scale it effectively using the same DBMS that you use for analytics.
That's not to say that there's nothing you can do (in fact, Tinybird is pretty decent at full-text search) but bear in mind that this is going to come with some nuance. Full-text search is too much to cover here in depth, but you can learn a lot more about how it is implemented (and learn about Bloom filters and ngram indices!) in this detailed post.
Takeaways
Log analytics is a deep and complex topic, and even in these many words I have barely scratched the surface of all there is. But, here's what we covered.
- How to move data to a log analytics system.
- How to keep the data from multiple users efficiently and securely.
- How to give your log explorer a very efficient overview of the data to make exploration easier and faster.
- How to make the actual log retrieval faster for a better exploration experience.
- How to make text search over your logs more efficient.
If giving your users the ability to explore or analyze their usage logs is on your roadmap, Tinybird could be a good a solution for you. Big companies like Vercel use Tinybird for multi-tenant logs analytics, and you can too.
Couple of ways to approach this:
1. Start with a simple prompt and modify it as you need:
2. Get more of a head start with this log analytics template. You can deploy it and tweak on your own (or view a demo implementation).
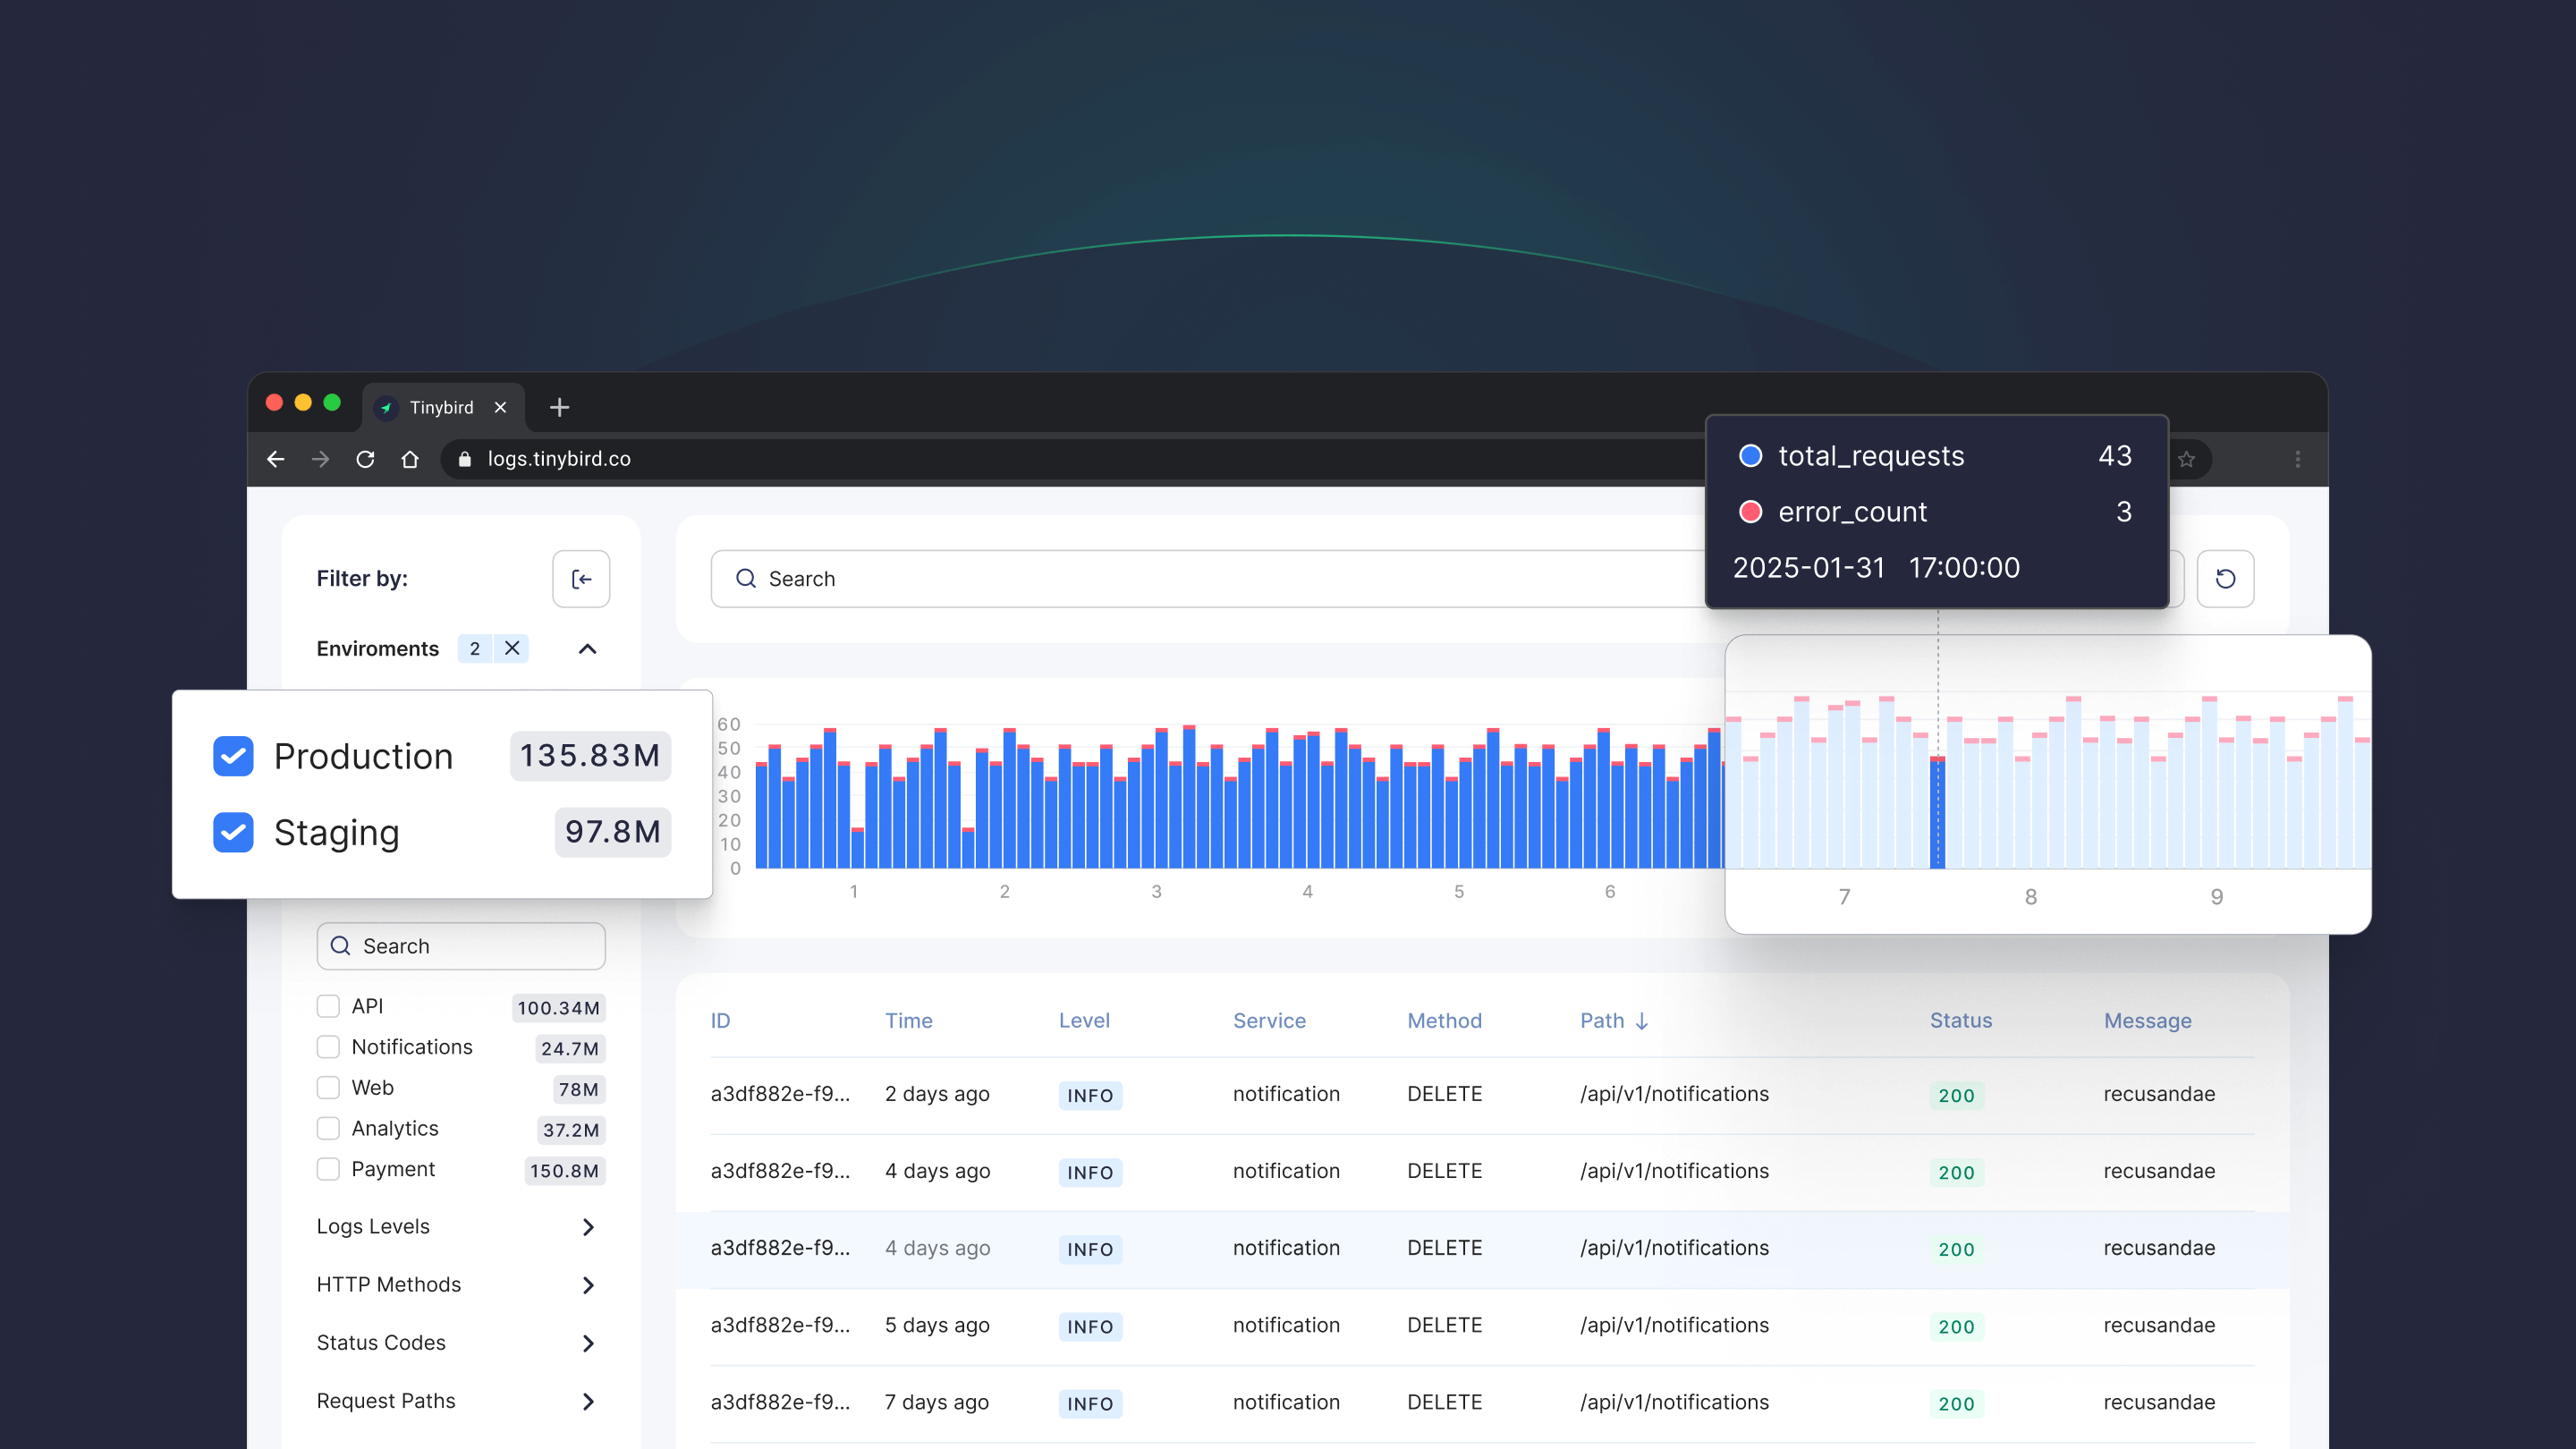
A demo of the Tinybird logs analytics template, which you can deploy here