Which LLM writes the best analytical SQL?
Can natural language replace SQL? We benchmarked the SQL-writing ability of the top 19 LLMs to find out.


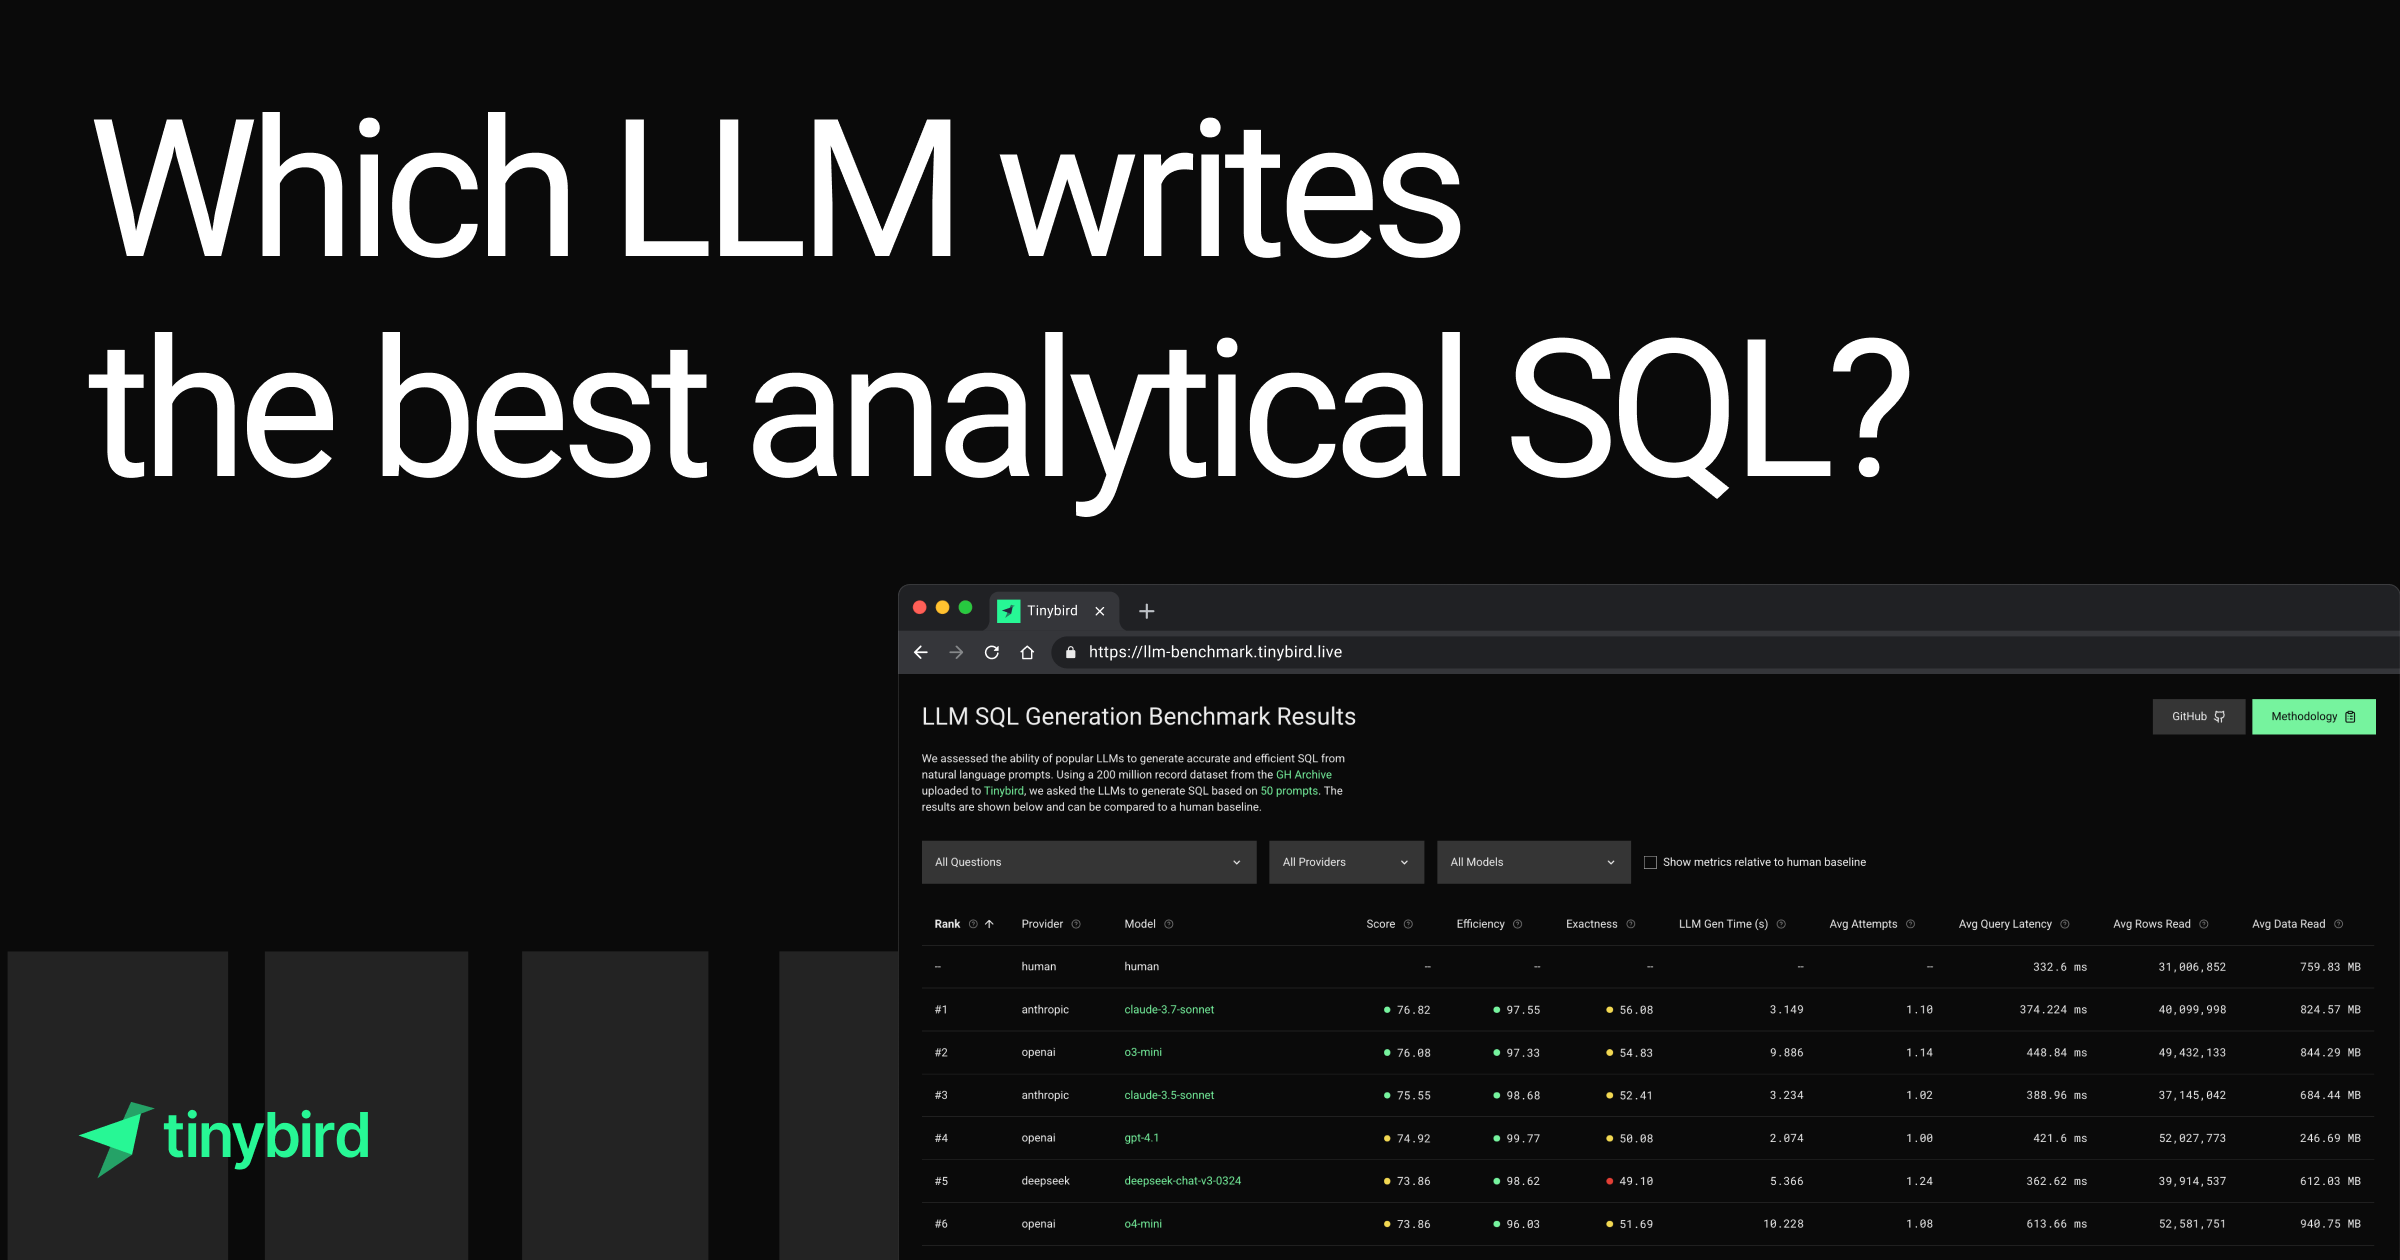
We asked 19 popular LLMs (+1 human) to write analytical SQL queries to filter and aggregate a 200 million row dataset. The result is the first version of the LLM SQL Generation Benchmark.
Using a set of 50 analytical questions inspired by this list from maintainers of ClickHouse®, we measure how well each model can write accurate and efficient SQL. We benchmark success rates, exactness, efficiency, query latency, and other metrics, comparing them to queries produced by an experienced human engineer.
The dataset, which contains 200 million rows of public GitHub events data (sampled from the GH Archive), is hosted in Tinybird, allowing us to run all the queries interactively and measure performance at scale. The full dashboard with results is public here. We will continually update this dashboard as new models are developed and tested (Want us to test a model? Create an issue or run the test yourself and submit a PR with new results here).
Why We’re Doing This
With features like Forward and Explorations, Tinybird is making LLMs a core part of the product experience. That means our users are directly affected by the quality of model-generated SQL, both in correctness and performance.
We built this benchmark to:
- Continuously evaluate how models behave in real, messy data scenarios.
- Catch regressions or silent failures as models evolve.
- Understand tradeoffs between accuracy, latency, and cost.
- Guide how we prompt, post-process, or choose models in production.
In essence, we're making sure LLMs actually work for SQL generation in the real world. Spoiler: it's not great… yet.
The Dataset: GitHub Archive
The GitHub Archive, a public dataset with all GitHub events since 2011, serves as source data for the benchmark. The archive contains billions of rows tracking stars, forks, issues, PRs, comments, pushes, etc.
We have randomly sampled a 200 million row subset of the original dataset for the benchmark. The data is stored in Tinybird as a single MergeTree table with this schema. It includes a mix of enums, low-cardinality strings, timestamps, and arrays.
The Questions
Each LLM must produce SQL from 50 natural language prompts or questions about public GitHub activity. You can find the whole list of questions here.
Each question is phrased like a natural-language prompt: “Top 10 repositories by stars over the past 7 days”, etc.
Models must:
- Parse the question
- Write correct SQL (valid syntax, correct columns, correct grouping)
- Run it against the table and return accurate output
The System Prompt
Each model receives the same system prompt. It tells the model exactly what to do and what not to do, for example:
- "You are not allowed to hallucinate fields. If a field is not in the schema, the query is invalid."
- "Do not select all columns. Avoid SELECT * unless explicitly required."
- "LIMIT without ORDER BY is not allowed."
Other instructions:
- Return only SQL. No explanations.
- Optimize for performance: minimize
rows_read. - The full table schema is included in the prompt (via inlined schema)
- A full list of available fields and compatible functions is provided (
countIf,multiIf,arrayJoin, etc).
Models Tested
So far, we have tested 19 models from Anthropic, OpenAI, Google, Meta, DeepSeek, and Mistral, including:
- Claude 3.5 & 3.7 Sonnet (Anthropic)
- Gemini 1.5 Pro (Google)
- GPT-4 Turbo (2024-03) (OpenAI)
- LLaMA 3 70B / 8B (Meta)
- Mistral 7B & Mixtral1
- DeepSeek Chat v3 (paid and free)
Over time, we intend to expand our testing and will include new models by the major providers as they are released.
How We Measure Performance
Each query is scored using these metrics:
| Metric | Meaning |
|---|---|
| Valid Query Rate | % of questions that returned valid, executable SQL code |
| First Attempt Rate | % of questions where a valid query was returned on first try |
| Execution Time | SQL execution latency (ms) |
| LLM Gen Time | Time the model took to generate a response |
| Attempts | How many retries were needed for valid SQL to be generated |
| Rows Read | How many rows were read per query executed |
| Data read | How much data (in bytes) was read per query executed |
| Query Length | Token count of the SQL |
In addition to raw performance metrics, we compute a few derived scores to better capture overall quality. These scores combine correctness and efficiency into interpretable values:
| Metric | Meaning |
|---|---|
| Efficiency score | How good is an LLM at generating a query, based on how fast that query is generated, how few attempts are needed, and how fast does the query execute? (more below) |
| Exactness score | How close is the output of that query to the human equivalent? (more below) |
| Overall Score | (Efficiency + Exactness) / 2 |
These derived metrics help highlight tradeoffs: some models are precise but inefficient, others fast but error-prone.
Measuring Output Efficiency
An important consideration when asking an LLM to generate analytical SQL queries is how efficient they are with compute resources. In ad hoc analytics and business intelligence scenarios, the impact is likely negligible and worth the tradeoff in human resource time.
However, in real-time, high-concurrency scenarios where queries may be run thousands or millions of times per day, inefficient queries compound and can consume significant compute resources at great expense or UX degradation.
We calculate an efficiency score, which considers both how efficient an LLM is in generating a query (number of retries, total generation time, failures) as well as how efficient the query itself is in terms of rows/data read, bytes per row, and latency. Here you'll find the code we use to calculate rawEfficiencyScore (which is then normalized to a 0-100 scale, with 100 being most efficient).Based on our benchmark results, it seems LLMs can often produce queries that are accurate OR efficient, but less often produce queries that are both accurate AND efficient, especially as prompt complexity increases.
Some of this may be explained by the system prompt: we ask LLMs to minimize the amount of data read, which may influence their willingness to refine a query until it is accurate if that means making the query less efficient (though we have not tested this assumption with different prompt variations).
Some LLMs seem to generate accurate SQL at the expense of efficiency: either they make multiple attempts or produce queries that read considerably more data than those written by a human. For example, OpenAI o4-mini-high managed to produce functional SQL for all 50 prompts, but on average read 32% more data than a human, the highest of all models.
In other cases, LLMs write efficient queries, but they don't answer the prompt. For example, Meta llama-4-scout seems to write efficient queries in terms of data processing, but in many cases, it either failed to produce a valid query or wrote a functional query that did not address the prompt. That is, the queries are "inexact"…
Measuring Output Exactness
When comparing the output of LLM-generated queries to human-written ones, the challenge isn’t just checking whether the query runs — it’s whether it returns semantically similar results. But since the shape and order of SQL results can vary (e.g., column names or positions don’t matter), traditional exact matching breaks down, and a more heuristic approach must be taken.
Instead, we treat query results as sets of rows and measure their similarity using set-based and numeric distance metrics:
- Jaccard Distance (0 = identical, 1 = no overlap): compares results as sets of unique rows, ignoring order and column names.
- Numeric RMSE (0 = identical, 1 = maximally divergent): compares numeric values in matching rows, accounting for relative error.
- F-Score (higher is better): balances precision and recall between both result sets to capture partial correctness.
You can see how this is calculated in result-validator.ts in the benchmark repository.
To ensure fairness, we apply the same metrics across all questions and models. We don’t adapt thresholds or swap distance functions on a per-case basis. This avoids cherry-picking and makes model comparisons meaningful, even if the numerical distance scale varies across queries.
Each query returns a set of booleans (matches, exactMatches, numericMatches) and raw distance values. These allow us to track both hard correctness (pass/fail) and how far off the result is — which is useful when the query is “almost right.”
You'll notice that even the highest-scoring model in terms of exactness, Anthropic's claude-3.7-sonnet, still only scores slightly more than 56 out of 100, on average, in our heuristic measure of exactness.
Key Results
Many models did fine on correctness but missed huge optimization opportunities. Others frequently failed on correctness while still producing technically efficient queries. Here are the most relevant takeaways from the benchmark, broken down by model group and ranked performance.
Claude dominates accuracy (but not speed)
- Claude 3.7 ranks #1 overall. Claude 3.5 is #3.
- Both score 100% valid queries and over 90% generation on first attempt.
- Average exactness is relatively high (~52–56), but not perfect.
- LLM generation time is slower (~3.2s).
- Rows read: ~37M–40M — not the worst, but not exceptionally efficient.
OpenAI’s o3/o4 models are solid all-rounders
- o3-mini ranks #2. o4-mini is close behind at #6.
- 100% valid queries, ~88–92% first attempt rate.
- Exactness ~51–55.
- Latency under 700ms.
- Rows read: ~49M–52M — competitive, but not top-tier.
LLaMA 3 fails, LLaMA 4 recovers
- LLaMA 3.3 70B is dead last (#19).
- Only 66% valid queries.
- Weak 52% first attempt rate.
- Exactness: 35.56.
- LLaMA 4 Maverick (#9) and Scout (#11) do much better.
- Validity: 100% and 96%.
- Scout reads the least data overall: 129MB/query.
- Exactness: 44–48.
Gemini drops due to latency
- Gemini 2.5 Pro Preview (#12) is accurate (91.8%) but slow: 40s/gen.
- Flash versions (2.0 and 2.5) have faster response times.
- But lower exactness (~40–42) and weaker scores overall.
Humans still lead in efficiency
- Human SQL reads ~31M rows and just 760MB per query.
- No model gets close on raw cost or selectivity.
- Most models read 1.5x–2x more rows.
Takeaways
LLMs are good at writing SQL, but getting the right SQL (that is, the SQL that answers the prompt) is another story. Even when a query runs and returns data, that doesn’t mean it’s semantically correct, efficient, or trustworthy. These are the kinds of edge cases that matter in real-world analytics — and where human judgment still wins.
Correctness is not binary
Just because a query runs doesn't mean it's correct. Models often generate queries that return something, but the logic is flawed: incorrect filters, incorrect grouping, or the use of the wrong timestamp. These mistakes are subtle and hard to catch without knowing the intent.
Example: For “top 10 labels related to bugs or features,” a human typically uses arrayJoin(labels) and filters with ILIKE '%bug%' OR ILIKE '%feature%'. Most models either skip the arrayJoin or match labels exactly, missing entries like bugfix or feature-request.
This benchmark manually validates outputs. High success rates don’t always mean semantically correct results.
SQL is still a skill
Natural language often isn’t expressive enough for precise data logic. Prompts like “most active repos” or “top contributors” are vague. Do we count issues, PRs, comments, or stars? Over what time range? Using what filters?
LLMs can guess (and often guess well), but if you can’t write or read the query yourself, you can’t verify its correctness. SQL remains a necessary skill.
LLMs struggle with context
Even when models have access to the full schema, they miss contextual details. For instance, issue numbers aren't globally unique, and repo_name includes both org and project. These are easy to misinterpret if you don't fully understand GitHub’s event model.
Some LLMs collapse all events under shared fields or reuse identifiers across different contexts. That leads to incorrect joins, inflated counts, or silently wrong aggregations.
Real-time analytics ≠ Text-to-SQL
These are different problems. Real-time systems like Tinybird prioritize performance under load: latency, throughput, and columnar efficiency. LLMs mostly ignore this unless specifically directed.
Example: For “top 10 repositories by issue comments,” a human filters event_type = 'IssueCommentEvent' and aggregates per repo. Some models try to use IssuesEvent and rely on the static comments field, which only reflects the current issue state (not the full event stream). Others overcomplicate things with joins that don’t make sense.
These queries aren't just inefficient: they’re wrong in any time-based or streaming context.
LLMs guess, humans hedge
When uncertain, LLMs tend to overdo it: reading more rows, selecting more fields, or broadening filters. That bloats resource usage and warps results.
Example: Instead of filtering for 4–5 specific event types, a model might count contributors across all events, including forks, releases, and even gists. That leads to noisy, inflated outputs.
Humans tend to be more conservative. Even if they undercount, the logic is easier to verify and control.
Data exposure is a tradeoff
The best model results come when the model has access to real data. But doing that exposes private or sensitive information, especially when querying with user-level or auth-bound fields.
There’s no real solution yet. This is still an active area of research, and a growing concern in multi-tenant platforms that want to use LLMs safely.
Some guidance
If you're building analytics tools with LLMs in the loop, some recommendations:
- Inject schema awareness - Provide database structure, table relationships, and data types as context to help the LLM generate accurate queries and understand data limitations.
- Implement query linting and validation - Add post-processing to check generated SQL for syntax errors, performance issues, or security vulnerabilities before execution.
- Balance penalties for inefficiency, inexactness, and gen time based on context - Your use case determines whether query efficiency, exactness, or generation speed is more important.
- Build feedback loops with execution results - Capture query outcomes and error messages to iteratively improve generated queries when initial attempts fail.
- Chain specialized models - Use different LLMs for different parts of the analytical pipeline (query generation, visualization suggestion, result interpretation).
- Add guardrails with structured output formats - Use markup tags to control response structure, ensuring consistent parsing for downstream processes.
- Implement self-evaluation checks - Have the model assess its own analytical outputs against defined criteria before presenting results.
- Create context-aware prompt templates - Develop standardized templates that incorporate user history, query patterns, and domain-specific constraints.
Explore the benchmark, contribute, and suggest models
You can find the full benchmark results here: https://llm-benchmark.tinybird.live/
The dashboard includes aggregate metrics across all questions, as well as per-model tables to see fine-grained model results and per-question tables to assess model performance on specific prompts.
We encourage contributions to this benchmark in the form of new models. If you'd like to benchmark a new model, please follow these steps and then submit a PR. Or, feel free to open an issue requesting a new model benchmark.